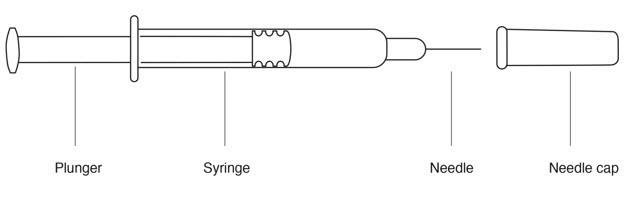
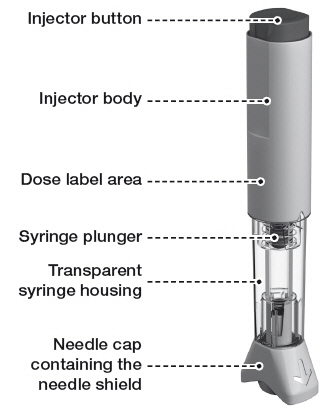
Figure 1 (Rebif 01)
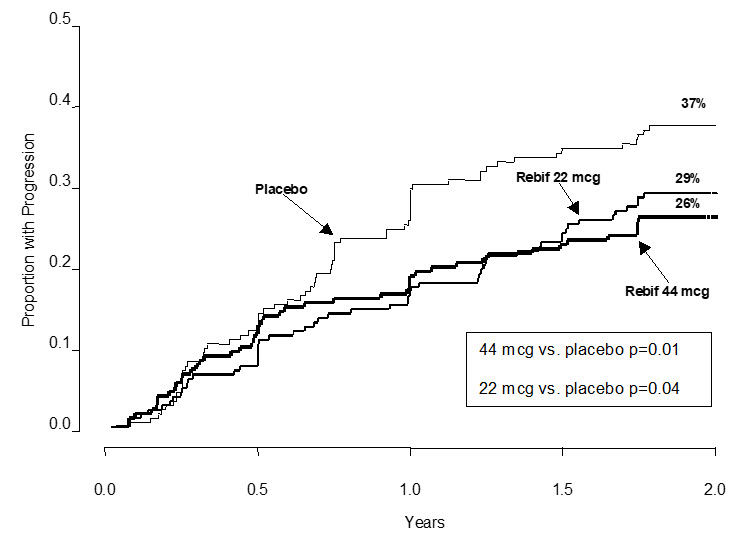
The text appears to be a graph that shows the proportion of patients who had progression over a certain number of years for a placebo group and two treatment groups (Rebif 44). The graph shows that both Rebif 44 treatment groups had a statistically significant lower proportion of patients with progression compared to the placebo group. The lower dose of Rebif 44 had a higher p-value (0.04) compared to the higher dose (0.01).*