Cyanocobalamin Spray
Product Images NDC 45802-491

View Photos of Packaging, Regulatory Labels, and Product Appearance

Product Visual Gallery

This gallery contains 5 technical images submitted to the FDA as part of the official labeling for Cyanocobalamin (NDC 45802-491). Unlike standard consumer photos, these assets often include clinical data figures, molecular chemical structures, and official manufacturer packaging layouts.

As provided by Padagis Israel Pharmaceuticals Ltd, these visuals offer a comprehensive scientific overview of the product's physical and chemical identity, aiding pharmacists and researchers in product verification and study.

FDA Label Image

Carton (Carton Rev04 23)

Carton (Carton Rev04 23)
The packaging label for Cyanocobalamin Nasal Spray 500 mcg/spray by Padagis Israel Pharmaceuticals Ltd shows a carton layout for four single-use nasal spray devices. The label lists inactive ingredients and emphasizes the product is prescription only, instructing not to prime before use and to keep out of children's reach. It includes patient instructions with illustrations on proper spray application.*
FDA Label Image

Image Of Hand Holding Nasal Spray (Figure A)

Image Of Hand Holding Nasal Spray (Figure A)
An instructional diagram showing a hand holding a nasal spray device. The illustration labels the nozzle and the plunger parts of the spray mechanism, indicating their positions on the device.*
FDA Label Image

Image Showing Nozzle Placement In Nostril (Figure B)

Image Showing Nozzle Placement In Nostril (Figure B)
An instructional illustration labeled Figure B showing a person using a finger to press on one nostril while the other nostril is open, demonstrating a step for administering a nasal spray.*
FDA Label Image

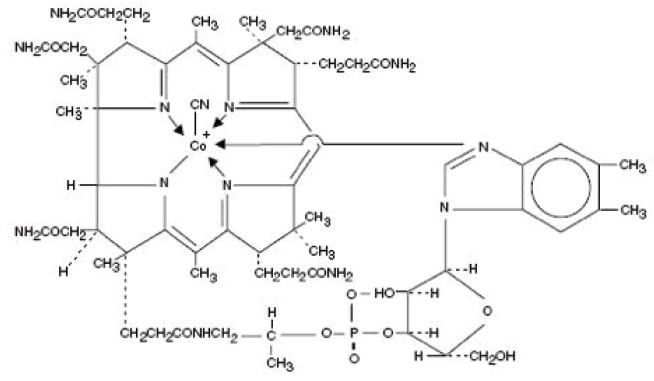
Chemical Structure Image (Image 01)

Chemical Structure Image (Image 01)
Chemical structure of cyanocobalamin, illustrating its complex molecular composition including the central cobalt ion, multiple ring structures, and attached functional groups.*
FDA Label Image

Figure-2 (Image 02)

Figure-2 (Image 02)
A line graph showing mean serum Vitamin B12 trough levels (pg/mL) with standard error of the mean over time at various points post doses. The x-axis marks time points from 1 month post intramuscular dose to 1 week after the fourth intranasal dose. The y-axis measures Vitamin B12 levels ranging from 200 to 600 pg/mL. The graph shows increasing Vitamin B12 levels with successive doses.*

* About these descriptions: Image descriptions on this page are generated by automated AI analysis of the product label images from the manufacturer's FDA label submission (SPL). They are provided for reference only and may contain errors or omissions. Always rely on the printed label itself and the official FDA labeling, and consult a pharmacist or healthcare professional with any questions about this product.