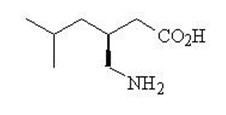
Pregabalin Capsules 75 mg (Pdp 107)
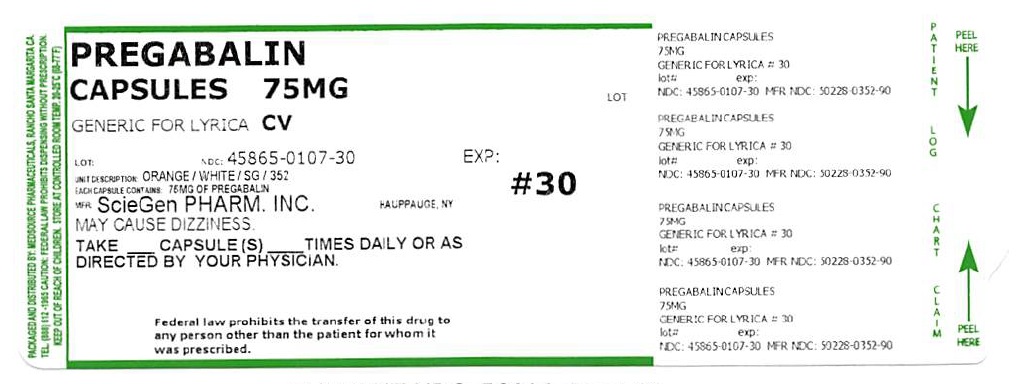
REGABALNCAPSUES is a generic version of Lyrica, consisting of 30 capsules each containing 75mg of Pregabalin. The drug is manufactured by ScieGen PHARM. INC. and may cause dizziness. It is recommended to take the capsules as directed by a physician and not to transfer the drug to anyone other than the patient for whom it was prescribed. The product is identified by HDC: 45885010730 MFR NDC: 50228-0352-90.*