Tramadol Hydrochloride
Product Images NDC 45865-120

4 FDA label images from Medsource Pharmaceuticals · Packaging, Regulatory Labels, and Product Appearance

Product Visual Gallery

This gallery contains 4 technical images submitted to the FDA as part of the official labeling for Tramadol Hydrochloride (NDC 45865-120). Unlike standard consumer photos, these assets often include clinical data figures, molecular chemical structures, and official manufacturer packaging layouts.

As provided by Medsource Pharmaceuticals, these visuals offer a comprehensive scientific overview of the product's physical and chemical identity, aiding pharmacists and researchers in product verification and study.

FDA Label Image

60's (Pdp 120)

60's (Pdp 120)
Packaging label for Tramadol HCl Tablets 50mg by Sun Pharm Ind., Inc. The label indicates this is a generic for Ultram, with a package quantity of 60 tablets. It mentions the tablets are white, oblong, film-coated, and provides usage instructions including dosing frequency and warnings about dizziness, drowsiness, and alcohol avoidance. Several NDC numbers and peel here tabs are visible on the label.*
FDA Label Image

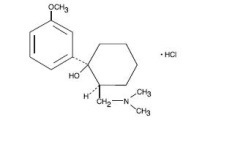
Structure (Tramadol 1)

Structure (Tramadol 1)
Chemical structure of tramadol hydrochloride showing its molecular framework including a cyclohexane ring bonded to functional groups such as a methoxyphenyl group, hydroxyl group, and dimethylaminomethyl side chain with an associated hydrochloride component.*
FDA Label Image

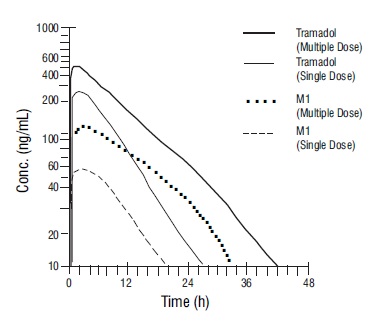
Figure 1 (Tramadol 2)

Figure 1 (Tramadol 2)
A pharmacokinetic graph depicting the concentration (ng/mL) over time (hours) for tramadol and its metabolite M1 after single and multiple doses. The graph shows four curves comparing tramadol and M1 concentrations, highlighting their changes in plasma levels up to 48 hours post-dose.*
FDA Label Image

Figure 2 (Tramadol 3)

Figure 2 (Tramadol 3)
A line graph titled 'Protocol CAPSS-047 Time to Discontinuation Due to Nausea/Vomiting' showing percent discontinuing on the y-axis and days in double-blind on the x-axis. The graph depicts increasing discontinuation percentages over a 25-day period for a dose of 200 mg/day over 10 days.*

* About these descriptions: Image descriptions on this page are generated by automated AI analysis of the product label images from the manufacturer's FDA label submission (SPL). They are provided for reference only and may contain errors or omissions. Always rely on the printed label itself and the official FDA labeling, and consult a pharmacist or healthcare professional with any questions about this product.