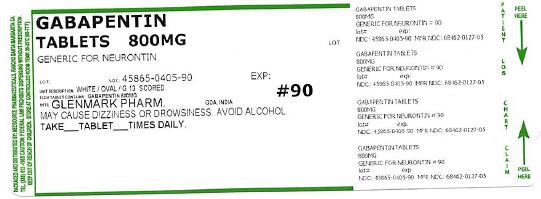
Gabapentin
Product Images NDC 45865-405
View Photos of Packaging, Regulatory Labels, and Product Appearance
Product Visual Gallery
This gallery contains 9 technical images submitted to the FDA as part of the official labeling for Gabapentin (NDC 45865-405). Unlike standard consumer photos, these assets often include clinical data figures, molecular chemical structures, and official manufacturer packaging layouts.
As provided by Medsource Pharmaceuticals, these visuals offer a comprehensive scientific overview of the product's physical and chemical identity, aiding pharmacists and researchers in product verification and study.
Equation.jpg (Equation)
Fig2.jpg (Fig 2)
This appears to be a chart showing the mean pain score for different treatments during a 4-week fixed dose period. The chart compares a placebo treatment to two different doses of gabapentin (1800 mg/day and 2400 mg/day). The pain scores were recorded at baseline and for each week during the treatment period.*
Fig3.jpg (Fig 3)
This text represents the results of two controlled studies on PHN (post-herpetic neuralgia) with two different drugs as treatments. The figure shows the percentage of patients who responded to treatment by experiencing a reduction in pain score by at least 50%. The percentages range from 3% to 90% in different groups corresponding to the two studies and the different dosages of the drugs. The text also includes some statistical significance indicators (*p<0.01 and *+p<0.001) and abbreviations for the drugs used (PBO, GBP).*
Fig4.jpg (Fig 4)
Fig1.jpg (Image 01)
Logo.jpg (Logo 01)
Logo.jpg (Logo)
Structure.jpg (Structure)
* These product label images have been analyzed using experimental machine learning. Please verify findings with the primary label text.