Product Images Metformin Hydrochloride

View Photos of Packaging, Labels & Appearance

Product Label Images

The following 10 images provide visual information about the product associated with Metformin Hydrochloride NDC 45865-517 by Medsource Pharmaceuticals, such as packaging, labeling, and the appearance of the drug itself. This resource could be helpful for medical professionals, pharmacists, and patients seeking to verify medication information and ensure they have the correct product.

bd3a3e6-1b64-4bda-88db-ae433d17dc8a - 0bd3a3e6 1b64 4bda 88db ae433d17dc8a

bd3a3e6-1b64-4bda-88db-ae433d17dc8a - 0bd3a3e6 1b64 4bda 88db ae433d17dc8a

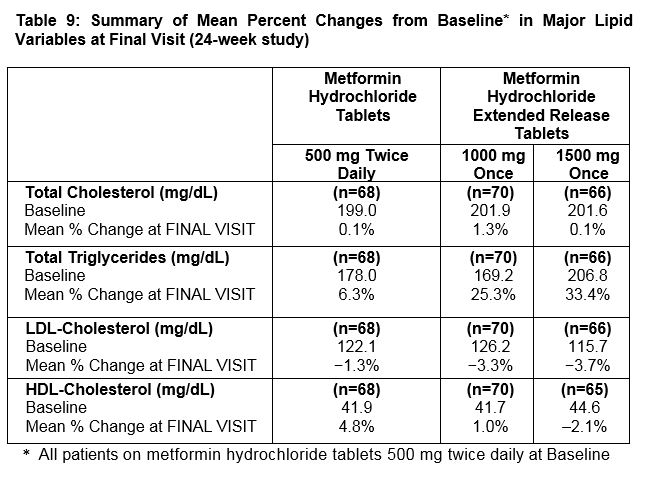
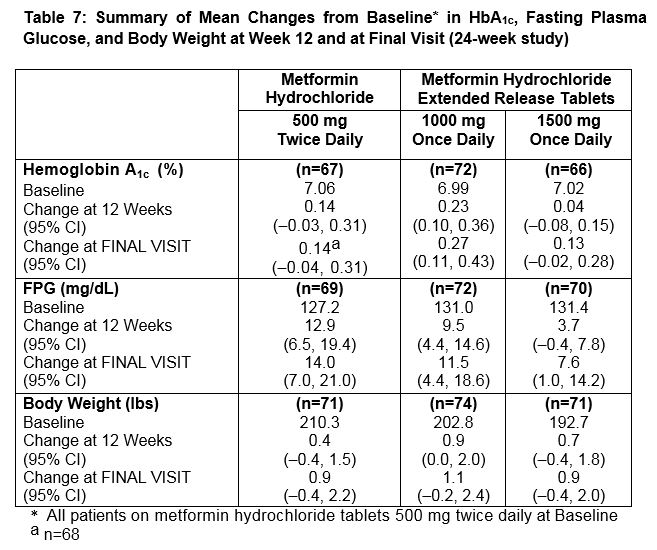
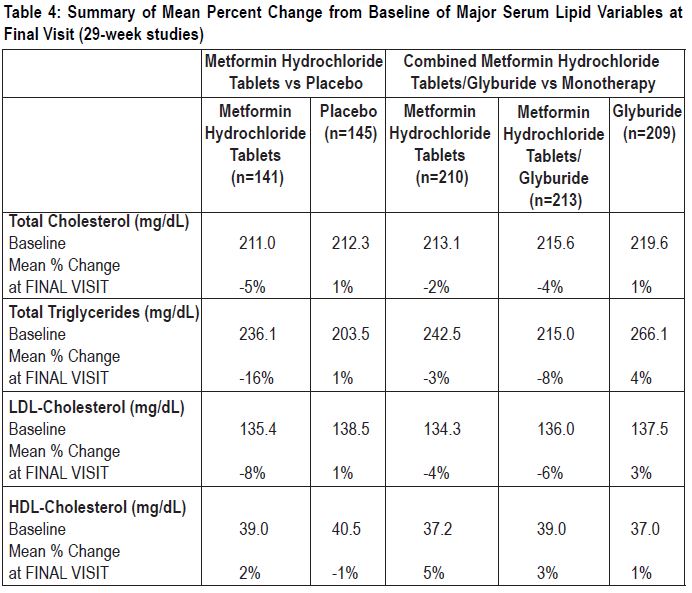
The table displays a summary of mean percent changes in major lipid variables after a 24-week study involving metformin hydrochloride tablets of extended release of 500 mg twice a day, 1000 mg once a day, and 1500 mg once daily. The variables include total cholesterol, total triglycerides, LDL-cholesterol, and HDL-cholesterol. The mean percent change of each variable is calculated from the baseline and shows varying results at the final visit.*

5fec0b40-figure-01 - 3657f435 figure 01

5fec0b40-figure-01 - 3657f435 figure 01

705cc8a-5055-412c-825a-80a3fd5b9c7a - 3705cc8a 5055 412c 825a 80a3fd5b9c7a

705cc8a-5055-412c-825a-80a3fd5b9c7a - 3705cc8a 5055 412c 825a 80a3fd5b9c7a

The text provides a table with the summary of mean changes of a 24-week study in hemoglobin A1C, fasting plasma glucose, and body weight with Metformin Hydrochloride Extended Release Tablets at different dosages. The table shows changes from baseline at week 12 and at the final visit. A total of 68 patients were treated twice daily with 500 mg Metformin Hydrochloride tablets at baseline.*

pdp - 517

pdp - 517

This text appears to be a medication label for Metformin HCL tablets 500mg, which is a generic version of the drug Glucophage used to treat diabetes. The label warns against consuming alcohol while taking the medication and advises taking the tablets as directed. It also mentions the manufacturer, Zheritage Pharm.*

0403393-33b1-484a-a4d0-8c0a182f0dbd - 60403393 33b1 484a a4d0 8c0a182f0dbd

0403393-33b1-484a-a4d0-8c0a182f0dbd - 60403393 33b1 484a a4d0 8c0a182f0dbd

The table summarizes the mean percent change of major serum lipid variables after 29-week studies for four different groups - Metformin Hydrochloride vs Placebo and Combined Metformin Hydrochloride Tablets/Glyburide vs Monotherapy. The table provides data for the Total Cholesterol, Total Triglyceride, LDL-Cholesterol, and HDL-Cholesterol. Each group's baseline and mean percentage change at the FINAL VISIT are listed.*

dadc8a7-4fe8-4830-9bd5-82f3a0e5184c - 6dadc8a7 4fe8 4830 9bd5 82f3a0e5184c

dadc8a7-4fe8-4830-9bd5-82f3a0e5184c - 6dadc8a7 4fe8 4830 9bd5 82f3a0e5184c

This text provides information about a pediatric study. The mean age of the patients was 13.8 years and they were all on diet therapy at the beginning of the study. However, there is no significant statistical difference noted in the text.*

1c10ce2-2e46-47dd-b7e7-1083fe41137b - 71c10ce2 2e46 47dd b7e7 1083fe41137b

1c10ce2-2e46-47dd-b7e7-1083fe41137b - 71c10ce2 2e46 47dd b7e7 1083fe41137b

The text is a summary of a 29-week study comparing Metformin Hydrochloride Tablets to Placebo in terms of the mean changes from baseline in fasting plasma glucose, HbA, and body weight at the final visit. The table shows the results for each category, including baseline values and changes at the final visit. The study included patients on diet therapy at baseline, and some values were not statistically significant.*

48c0b5f-a8ef-49a1-9fc4-acb66265226f - 748c0b5f a8ef 49a1 9fc4 acb66265226f

48c0b5f-a8ef-49a1-9fc4-acb66265226f - 748c0b5f a8ef 49a1 9fc4 acb66265226f

Table 10 shows a summary of the mean changes of Metformin Hydrochloride Tablets vs Placebo in Pediatrics. It compares the changes in plasma glucose and body weight at the final visit. The table displays the baseline and the change at final visit for both the tablets and the placebo groups. The results indicate that the Metformin Hydrochloride Tablets group had a greater decrease in plasma glucose and increase in body weight compared to the placebo group. The p-value for the difference in plasma glucose change was less than 0.001, while the change in body weight for the Metformin Hydrochloride Tablets group was not statistically significant compared to the placebo group.*

c630784-d07a-495b-95e7-b3de307bd6c8 - 9c630784 d07a 495b 95e7 b3de307bd6c8

c630784-d07a-495b-95e7-b3de307bd6c8 - 9c630784 d07a 495b 95e7 b3de307bd6c8

2e2c0e5-1dbe-449d-885e-e3a329b03f2e - d2e2c0e5 1dbe 449d 885e e3a329b03f2e

2e2c0e5-1dbe-449d-885e-e3a329b03f2e - d2e2c0e5 1dbe 449d 885e e3a329b03f2e

This is a summary table presenting results of a study comparing combined Metformin Hydrochloride Tablets and Insulin treatment with placebo for patients with Hemoglobin A1c disorder. The table shows the mean changes from baseline in HbA1 and insulin dose, with the corresponding values for Metformin Hydrochloride Tablets/Insulin and Placebo/Insulin. The treatment difference is also presented. The results indicate a statistically significant difference for the Metformin Hydrochloride Tablets/Insulin treatment using analysis of covariance (p=0.04), but not for the Placebo/Insulin treatment using analysis of variance. The insulin dose had a statistically significant difference (p=0.04) for both treatments.*

* The product label images have been analyzed using a combination of traditional computing and machine learning techniques. It should be noted that the descriptions provided may not be entirely accurate as they are experimental in nature. Use the information in this page at your own discretion and risk.