Topiramate
Product Images NDC 45865-551

View Photos of Packaging, Regulatory Labels, and Product Appearance

Product Visual Gallery

This gallery contains 4 technical images submitted to the FDA as part of the official labeling for Topiramate (NDC 45865-551). Unlike standard consumer photos, these assets often include clinical data figures, molecular chemical structures, and official manufacturer packaging layouts.

As provided by Medsource Pharmaceuticals, these visuals offer a comprehensive scientific overview of the product's physical and chemical identity, aiding pharmacists and researchers in product verification and study.

FDA Label Image

Pdp (551)

Pdp (551)
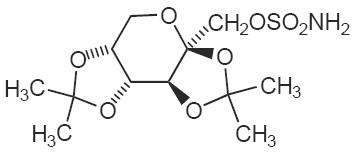
This is a description of Topiramate tablets in 25mg strength. It is a generic version of the drug Topamax. The text contains dosage instructions advising taking the tablet(s) twice daily. The medication should be taken carefully as it may cause dizziness and drowsiness, especially if alcohol is consumed.*
FDA Label Image

Chemical-structure (Chemical Structure)

FDA Label Image

Figure-1jpg (Figure 1)

Figure-1jpg (Figure 1)
The text describes a figure denoted as Figure 1 which represents the Kaplan-Meier estimates of cumulative rates for time to the first seizure. The graph displays the days on the X-axis and the different dosages of Topiramate (in mg/day) on the Y-axis. The cumulative rates of seizures are also represented on the Y-axis. The different dosages are represented by a different color line. The figure has a title but no further information is provided.*
FDA Label Image

Figure-2 (Figure 2)

Figure-2 (Figure 2)
This text is providing data related to the change in the average monthly rate of migraine periods during a double-blind phase with different doses of topiramate compared to a placebo group. The data is presented in a chart with different groups based on the dosage of topiramate, and the sample sizes for each group are provided. The study is labeled as Study 10 and Study 11. The text also includes two asterisks indicating significant differences (p < 0.001) between the groups.*

* These product label images have been analyzed using experimental machine learning. Please verify findings with the primary label text.