Duloxetine
Product Images NDC 45865-813

View Photos of Packaging, Regulatory Labels, and Product Appearance

Product Visual Gallery

This gallery contains 8 technical images submitted to the FDA as part of the official labeling for Duloxetine (NDC 45865-813). Unlike standard consumer photos, these assets often include clinical data figures, molecular chemical structures, and official manufacturer packaging layouts.

As provided by Medsource Pharmaceuticals, these visuals offer a comprehensive scientific overview of the product's physical and chemical identity, aiding pharmacists and researchers in product verification and study.

FDA Label Image

Pdp30mg (813 60)

Pdp30mg (813 60)
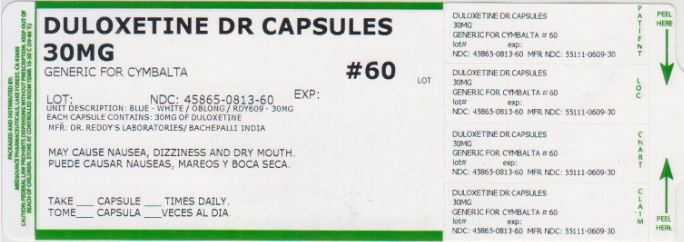
DULOXETINE DR CAPSULES are available in a 30mg dosage strength and are the generic version of CYMBALTA. The package contains 60 capsules. The medication may cause side effects such as nausea, dizziness, and dry mouth. The recommended dosage is to take the capsule multiple times a day. This medication is associated with the following NDC: 005912766.*
FDA Label Image

Pdp60mg (816 30)

Pdp60mg (816 30)
DULOXETINE DR CAPSULES 60mg is a generic for Cymbalta. Each capsule contains 60mg of Duloxetine. It is manufactured by Aedoy's Laboratories/Bachepall Thota. Taking the recommended dose may cause nausea, dizziness, and dry mouth. The prescription number, lot number, and NDC number are also provided on the label. However, the produced numerous typos and errors, making some parts of the text difficult to understand.*
FDA Label Image

Figure1 (Figure1)

FDA Label Image

Figure2 (Figure2)

FDA Label Image

Figure5 (Figure5)

Figure5 (Figure5)
The text is not available as it contains non-English characters.*
FDA Label Image

Figure6 (Figure6)

FDA Label Image

Figure7 (Figure7)

Figure7 (Figure7)
This appears to be a chart showing the percentage of patients improved with a medication called Dulonctine compared to a placebo. The doses listed are 60 mg/120mg once a day. The chart measures the percent improvement in pain from the baseline with the BOCF method. The chart shows varying percentages of improvement from 50 to 100 percent.*
FDA Label Image

Structure (Structure)

* These product label images have been analyzed using experimental machine learning. Please verify findings with the primary label text.