Tramadol Hydrochloride
Product Images NDC 45865-976

View Photos of Packaging, Regulatory Labels, and Product Appearance

Product Visual Gallery

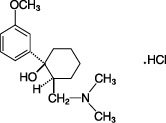
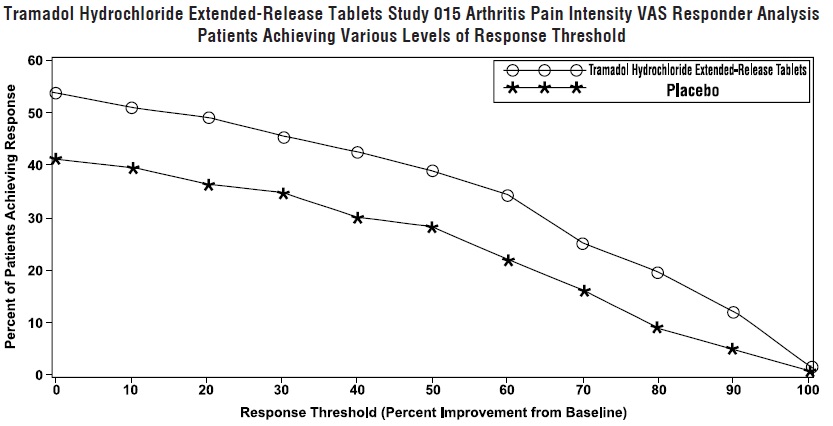
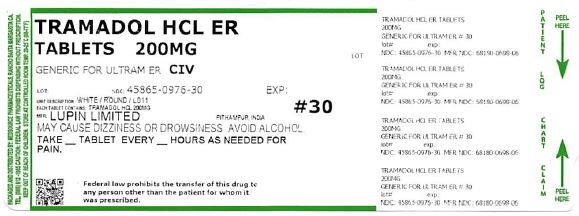
This gallery contains 6 technical images submitted to the FDA as part of the official labeling for Tramadol Hydrochloride (NDC 45865-976). Unlike standard consumer photos, these assets often include clinical data figures, molecular chemical structures, and official manufacturer packaging layouts.

As provided by Medsource Pharmaceuticals, these visuals offer a comprehensive scientific overview of the product's physical and chemical identity, aiding pharmacists and researchers in product verification and study.

FDA Label Image

Image-1 (33a5de83 A974 48a5 8ba6 4c1b97515615 01)

FDA Label Image

Image-2 (33a5de83 A974 48a5 8ba6 4c1b97515615 02)

Image-2 (33a5de83 A974 48a5 8ba6 4c1b97515615 02)
This appears to be a chart showing the concentration of Tramadol at different time intervals (in hours) for two different types of medication: Tramadol Hydrochloride Extended-Release Tablets (at a dosage of 200 mg per day) and Tramadol Hydrochloride Tablets (at a dosage of 50 mg every 6 hours). The Tramadol concentration (in ng/mL) is represented on the y-axis.*
FDA Label Image

Image-3 (33a5de83 A974 48a5 8ba6 4c1b97515615 03)

Image-3 (33a5de83 A974 48a5 8ba6 4c1b97515615 03)
This is a chart showing the concentration of M1 (a metabolite of tramadol) in ng/mL over time (in hours) for two different medications - Tramadol Hydrochloride Extended-Release Tablets (dosed at 200mg once daily) and Tramadol Hydrochloride Tablets (dosed at 50mg every 6 hours).*
FDA Label Image

Image-4 (33a5de83 A974 48a5 8ba6 4c1b97515615 04)

Image-4 (33a5de83 A974 48a5 8ba6 4c1b97515615 04)
This is a graph representing the percentage of patients who achieved different levels of pain relief after taking Tramadol Hydrochloride Extended-Release Tablets in a WOMAC Pain Responder Analysis study. The study had four variations of the tablets, 100mg, 200mg, 300mg, and 400mg. The results were compared to a placebo, represented by the bottom bar of the graph. The x-axis shows the response threshold, which is the percentage improvement from baseline. The graph has a bell curve shape, showing that the most significant number of patients improved their pain levels between 20% and 60% with the medication.*
FDA Label Image

Image-5 (33a5de83 A974 48a5 8ba6 4c1b97515615 05)

Image-5 (33a5de83 A974 48a5 8ba6 4c1b97515615 05)
This is a chart that shows the results of a study (Study 015) evaluating the effectiveness of Tramadol Hydrochloride Extended-Release Tablets on treating arthritis pain. The chart displays the percentage of patients who achieved a response to the drug at various levels of pain intensity. The drug is compared to a placebo control, represented by the empty space next to the drug graph. The x-axis shows the response threshold, indicating the percentage improvement from the patient's initial baseline pain measurement. The highest response rate is at 50% improvement, where almost 80% of patients showed a positive response to the drug.*
FDA Label Image

Pdp (976)

Pdp (976)
This text appears to be a prescription label for Tramadol HCL ER tablets with a strength of 200mg. The label also includes a warning to avoid alcohol and drowsiness while taking the medication. Unfortunately, due to the poor quality of , some of the text is difficult to read and some characters are non-English.*

* These product label images have been analyzed using experimental machine learning. Please verify findings with the primary label text.