Product Images Tadalafil

View Photos of Packaging, Labels & Appearance

Product Label Images

The following 10 images provide visual information about the product associated with Tadalafil NDC 45865-991 by Medsource Pharmaceuticals, such as packaging, labeling, and the appearance of the drug itself. This resource could be helpful for medical professionals, pharmacists, and patients seeking to verify medication information and ensure they have the correct product.

pdp - 991

pdp - 991

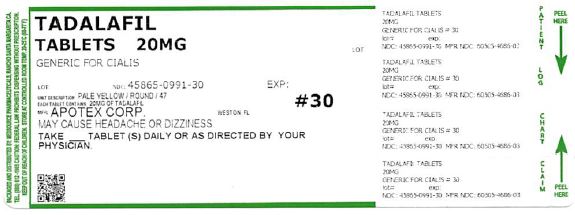
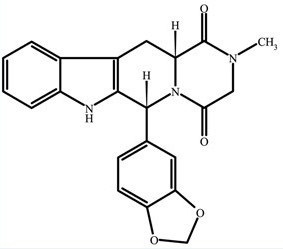
This is a medication label for Tadalafil, a generic version of a drug marked as "C", likely Cialis. The label suggests taking 20mg tablets once daily or as directed by a healthcare professional. It is unclear what "Y CAUSE HEX" and "9130 oazness" mean, as they may be misreadings from .*

Figure 5 - f005

Figure 5 - f005

This text is describing the change from baseline in IPSS total score. It includes a comparison between Tadalafil Tablets 5 mg and Placebo, indicating a significant difference between the two (p<0.01). However, no further information is provided about the study or patient population. It also includes a duration of treatment of 4 to 12 weeks.*

Figure 6 - f006

Figure 6 - f006

This is a report on IPSS total score, a medical assessment used to evaluate the severity of urinary symptoms. The report contains data on the efficacy of Tadalafil tablets (5mg) compared to a placebo in weeks of treatment. The text seems incomplete and contains random characters, indicating a possible error.*

Figure 7 - f007

Figure 7 - f007

Figure 8 - f008

Figure 8 - f008

This text appears to be a chart or graph, displaying the IPSS Total Score and the duration of treatment in weeks, with two groups represented by Tadalafil Tablets and Placebo. The asterisk and "p<0.01" suggest that there was a statistically significant difference between the two groups. However, the other characters such as "H", "F", "-", "a", "£", "2!", "°", and "S" do not provide any useful information and may be errors from the process.*

figure1 - figure1

figure1 - figure1

figure2 - figure2

figure2 - figure2

Not available.*

figure3 - figure3

figure3 - figure3

This appears to be a table or graph showing the systolic blood pressure in mmHg at different times after administration of either 20 mg tadalafil and 8 mg qd doxazosin, or placebo and 8 mg qd doxazosin. However, without the actual table or graph, it is difficult to provide more information.*

figure4 - figure4

figure4 - figure4

This text is a chart showing the plasma tadalafil concentrations in micrograms per liter (ug/L) at different time intervals (12, 24, 36, 48, 60, 72, 84, 96, 108, 120 hours) following the administration of different doses of tadalafil (20mg and 5mg) in single and once-daily doses for five consecutive days. The chart also includes symbols depicting the different doses. The text is useful to understand the plasma concentrations of tadalafil for different dosages and administration methods over time.*

Chemical Structure - structure

Chemical Structure - structure

* The product label images have been analyzed using a combination of traditional computing and machine learning techniques. It should be noted that the descriptions provided may not be entirely accurate as they are experimental in nature. Use the information in this page at your own discretion and risk.