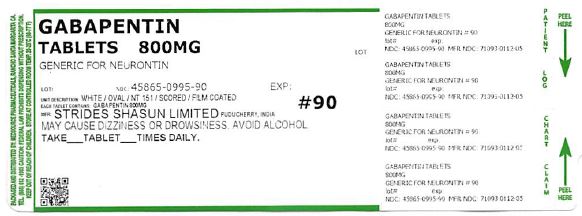
Gabapentin
Product Images NDC 45865-995
View Photos of Packaging, Regulatory Labels, and Product Appearance
Product Visual Gallery
This gallery contains 7 technical images submitted to the FDA as part of the official labeling for Gabapentin (NDC 45865-995). Unlike standard consumer photos, these assets often include clinical data figures, molecular chemical structures, and official manufacturer packaging layouts.
As provided by Medsource Pharmaceuticals, these visuals offer a comprehensive scientific overview of the product's physical and chemical identity, aiding pharmacists and researchers in product verification and study.
Product Images & Figures Index
Figure 1 (Ab1e0185 B802 4cf2 A5d4 B71f27f1dcb0 00)
Chem Structure (D45f499b 8612 479e 8dd2 4fe28b1f5f9c 01)
Figure01 (D45f499b 8612 479e 8dd2 4fe28b1f5f9c 02)
This appears to be a chart or graph displaying a pain score referred to as the "Moan Pain Score". The score is listed as 10, but it is unclear what this score represents without additional context. The chart also includes information about a 4-week dose titration period, a fixed dose period, and the use of gabapentin at a dose of 3600 mg/day. It is not possible to determine the purpose or context of this chart with the given information.*
Figure02 (D45f499b 8612 479e 8dd2 4fe28b1f5f9c 03)
Figure03 (D45f499b 8612 479e 8dd2 4fe28b1f5f9c 04)
The text describes a graph showing the proportion of responders to a treatment for patients with PHN (postherpetic neuralgia), characterized by a reduction in pain score of over 50%. The graph displays data from two controlled studies, but no further details about the treatment or studies are given. There are also some numeric values which could pertain to costs of the treatment.*
Figure4 (D45f499b 8612 479e 8dd2 4fe28b1f5f9c 05)
* These product label images have been analyzed using experimental machine learning. Please verify findings with the primary label text.