Atorvaliq Suspension
Product Images NDC 46287-030

View Photos of Packaging, Regulatory Labels, and Product Appearance

Product Visual Gallery

This gallery contains 5 technical images submitted to the FDA as part of the official labeling for Atorvaliq (NDC 46287-030). Unlike standard consumer photos, these assets often include clinical data figures, molecular chemical structures, and official manufacturer packaging layouts.

As provided by Cmp Pharma, Inc., these visuals offer a comprehensive scientific overview of the product's physical and chemical identity, aiding pharmacists and researchers in product verification and study.

FDA Label Image

Effect Of Atorvastatin 10 mg/day On Cumulative Incidence Of Non-fatal Myocardial Infarction Or Coronary Heart Disease Death (in Ascot-lla) (Image 02)
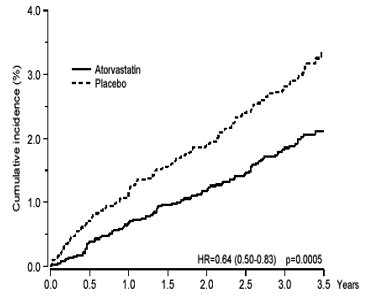
Effect Of Atorvastatin 10 mg/day On Cumulative Incidence Of Non-fatal Myocardial Infarction Or Coronary Heart Disease Death (in Ascot-lla) (Image 02)
A line graph comparing the cumulative incidence (%) of an outcome over a period of up to 3.5 years between two groups: Atorvastatin (solid line) and placebo (dashed line). The graph shows a consistently lower cumulative incidence for Atorvastatin compared to placebo, including a hazard ratio (HR) of 0.64 (95% CI 0.50-0.83) with a p-value of 0.0005.*
FDA Label Image

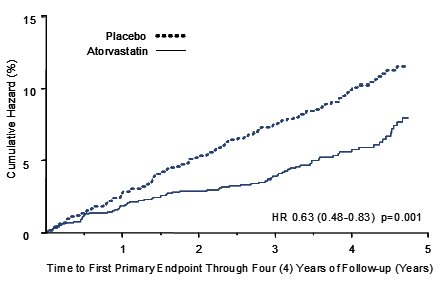
Effect Of Atorvastatin 10 mg/day On Time To Occurrence Of Major Cardiovascular Event (myocardial Infarction, Acute Chd Death, Unstable Angina, Coronary Revascularization, Or Stroke) In Cards (Image 03)

Effect Of Atorvastatin 10 mg/day On Time To Occurrence Of Major Cardiovascular Event (myocardial Infarction, Acute Chd Death, Unstable Angina, Coronary Revascularization, Or Stroke) In Cards (Image 03)
A cumulative hazard curve chart comparing the effect of Atorvastatin versus placebo. The x-axis represents time to first primary endpoint through four years of follow-up (years), and the y-axis shows cumulative hazard percentage. The chart includes hazard ratio (HR 0.63) with confidence intervals and p-value indicating statistical significance.*
FDA Label Image

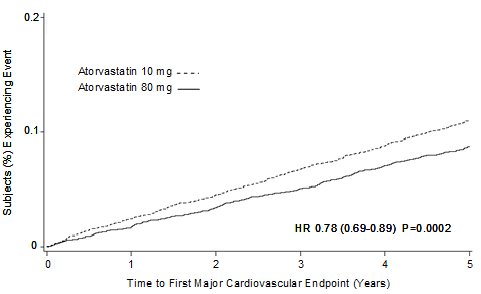
Effect Of Atorvastatin 80 mg/day Vs. 10 mg/day On Time To Occurrence Of Major Cardiovascular Events (tnt) (Image 04)

Effect Of Atorvastatin 80 mg/day Vs. 10 mg/day On Time To Occurrence Of Major Cardiovascular Events (tnt) (Image 04)
A Kaplan-Meier curve comparing time to first major cardiovascular endpoint over 5 years between two atorvastatin dosage groups: 10 mg (dashed line) and 80 mg (solid line). The y-axis represents the percentage of subjects experiencing an event. Hazard ratio, confidence interval, and p-value are noted in the graph.*
FDA Label Image

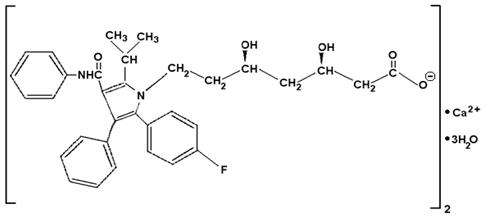
Chemical Structure (Spl 01)

Chemical Structure (Spl 01)
Chemical structure diagram of Atorvaliq, the active ingredient in ATORVALIQ oral suspension 20 mg/5 mL by CMP Pharma, Inc. The image shows the molecular arrangement including aromatic rings, functional groups, and calcium and hydrate components.*
FDA Label Image

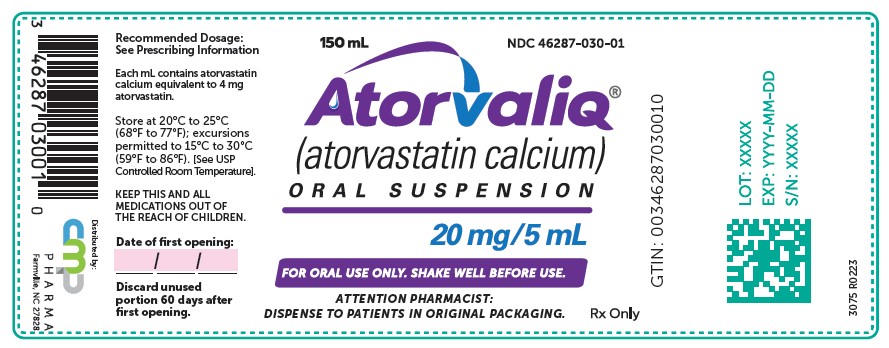
Principal Display Panel (10 mg Tablet Bottle Label)

Principal Display Panel (10 mg Tablet Bottle Label)
Label for Atorvaliq (atorvastatin calcium) oral suspension, 20 mg/5 mL, in a 150 mL container. The label includes storage instructions (20°C to 25°C with permitted excursions), dosage note, pharmacist dispensing instructions, and manufacturer information for CMP Pharma, Inc. It also shows a barcode, NDC 46287-030-01, and cautions to shake well before use and discard unused portion 60 days after opening.*

* About these descriptions: Image descriptions on this page are generated by automated AI analysis of the product label images from the manufacturer's FDA label submission (SPL). They are provided for reference only and may contain errors or omissions. Always rely on the printed label itself and the official FDA labeling, and consult a pharmacist or healthcare professional with any questions about this product.