Tadliq Suspension
Product Images NDC 46287-045

View Photos of Packaging, Regulatory Labels, and Product Appearance

Product Visual Gallery

This gallery contains 8 technical images submitted to the FDA as part of the official labeling for Tadliq (NDC 46287-045). Unlike standard consumer photos, these assets often include clinical data figures, molecular chemical structures, and official manufacturer packaging layouts.

As provided by Cmp Pharma, Inc., these visuals offer a comprehensive scientific overview of the product's physical and chemical identity, aiding pharmacists and researchers in product verification and study.

FDA Label Image

Structural Formula (Tadliq Chem V1)

Structural Formula (Tadliq Chem V1)
Chemical structure diagram of Tadalafil, the active ingredient in TADLIQ 20 mg/5mL oral suspension by CMP Pharma, Inc.*
FDA Label Image

Principal Display Panel (20 mg/5 mL)

Principal Display Panel (20 mg/5 mL)
The label for Tadliq (Tadalafil) Oral Suspension 20 mg/5 mL, manufactured by CMP Pharma, Inc. It indicates a 150 mL bottle with a blue and orange logo and highlights dosage information, storage instructions, and a note to shake well for 30 seconds before use. The label includes a barcode, NDC 46287-045-15, and is marked Rx only.*
FDA Label Image

Figure 1 (Tadliq Fig1 V1)

Figure 1 (Tadliq Fig1 V1)
A forest plot chart showing the mean differences and 95% confidence intervals for blood pressure changes when Tadalafil 20 mg or 10 mg is coadministered with various drugs compared to placebo. The chart includes measurements of systolic and diastolic blood pressure in standing, supine, and ambulatory positions with multiple coadministered drugs such as alcohol, alfuzosin, amlodipine, angiotensin II receptor blocker, doxazosin, tamsulosin, bendroflumethiazide, enalapril, and metoprolol. Data points are displayed with horizontal error bars representing confidence intervals along a scale of relative change from placebo.*
FDA Label Image

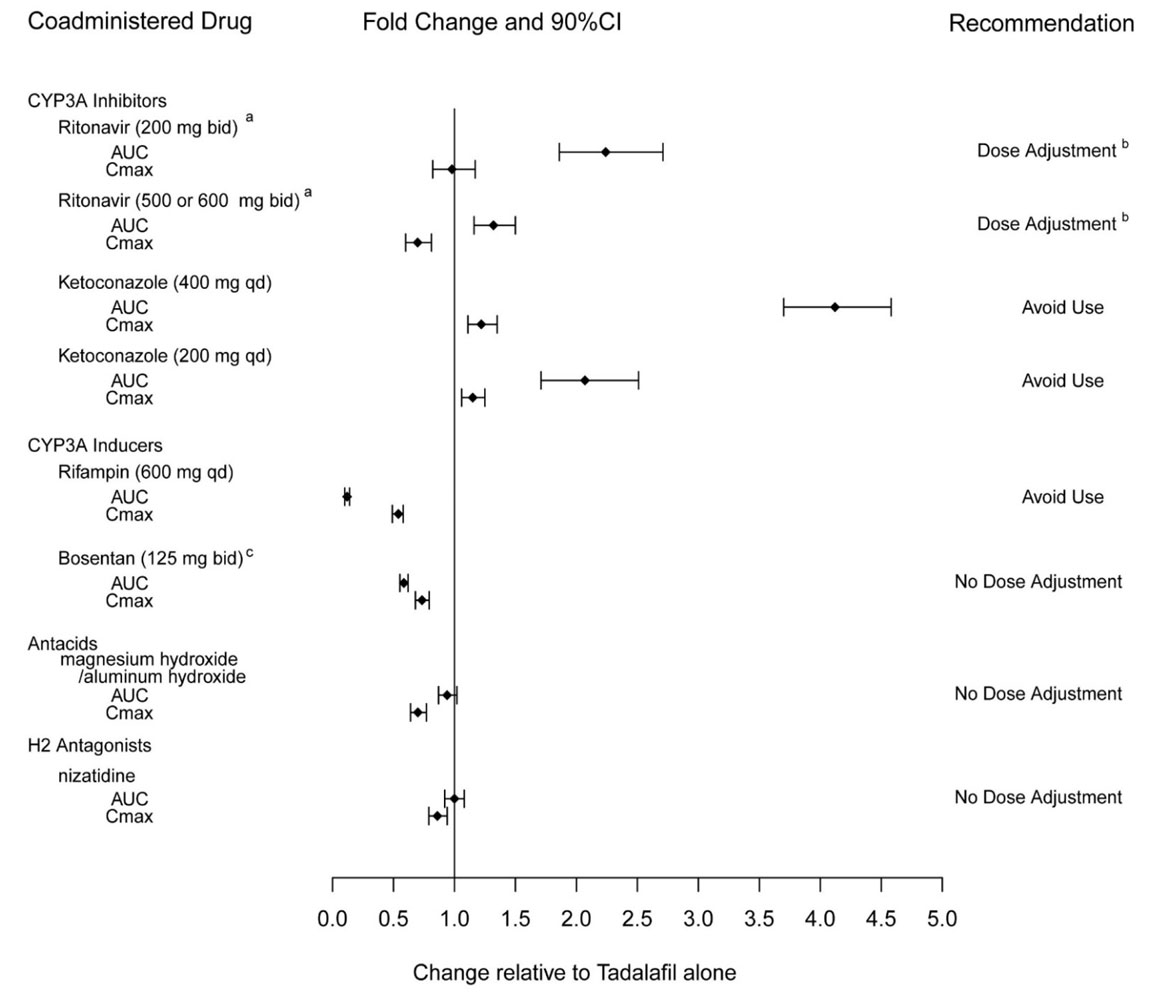
Figure 2 (Tadliq Fig2 V1)

Figure 2 (Tadliq Fig2 V1)
A chart showing fold change and 90% confidence intervals for drug interactions with Tadalafil. It compares area under the curve (AUC) and maximum concentration (Cmax) for coadministered drugs including CYP3A inhibitors (Ritonavir, Ketoconazole), CYP3A inducers (Rifampin, Bosentan), antacids, and H2 antagonists, with dosing recommendations such as dose adjustment, avoid use, or no dose adjustment.*
FDA Label Image

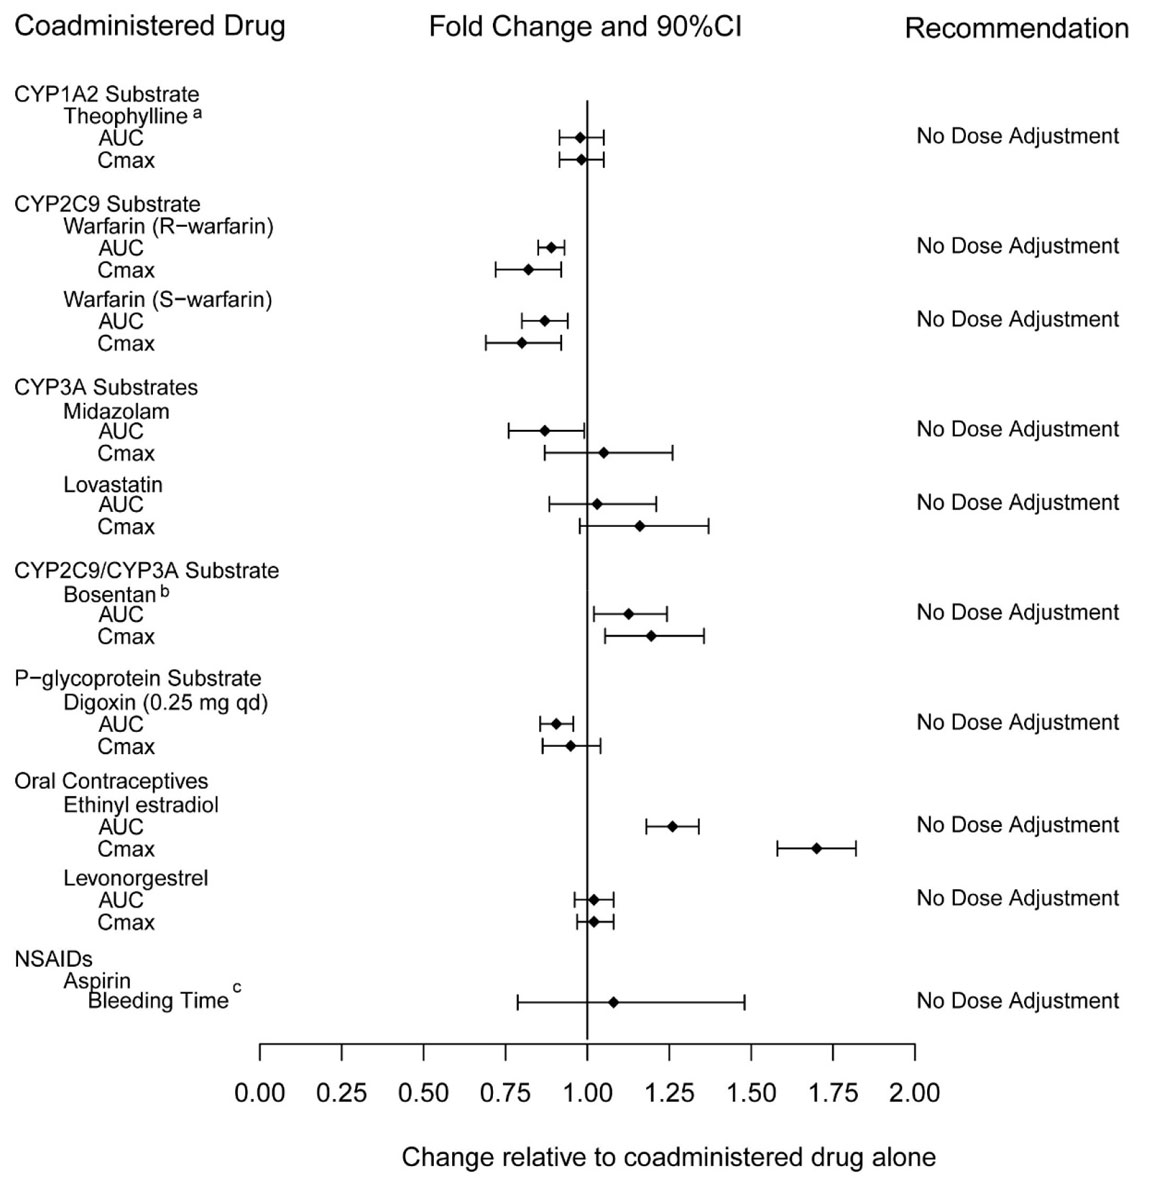
Figure 3 (Tadliq Fig3 V1)

Figure 3 (Tadliq Fig3 V1)
A forest plot chart showing fold change and 90% confidence intervals for various coadministered drugs with TADLI (Tadalafil). The chart compares AUC and Cmax values for several CYP substrates, P-glycoprotein substrates, oral contraceptives, and NSAIDs, all recommending no dose adjustment. The x-axis represents change relative to the coadministered drug alone.*
FDA Label Image

Figure 4 (Tadliq Fig4 V1)

Figure 4 (Tadliq Fig4 V1)
A line graph comparing the mean change from baseline in meters over 16 weeks between placebo (open circles, N=82) and Tadalafil 40 mg (filled circles, N=79). The vertical axis shows mean change in meters, and the horizontal axis shows time in weeks (0, 4, 8, 12, 16). Statistically significant differences at weeks 8, 12, and 16 are noted with asterisks indicating p-values.*
FDA Label Image

Figure 5 (Tadliq Fig5 V1)

Figure 5 (Tadliq Fig5 V1)
A horizontal forest plot showing placebo-adjusted mean changes in 6-minute walk distance (meters) with 95% confidence intervals for tadalafil 40 mg versus placebo across various subject subgroups. Subgroups include all subjects, bosentan use, PAH etiology, baseline 6-minute walk distance, gender, age, and baseline WHO functional class, with the number of subjects per group listed.*
FDA Label Image

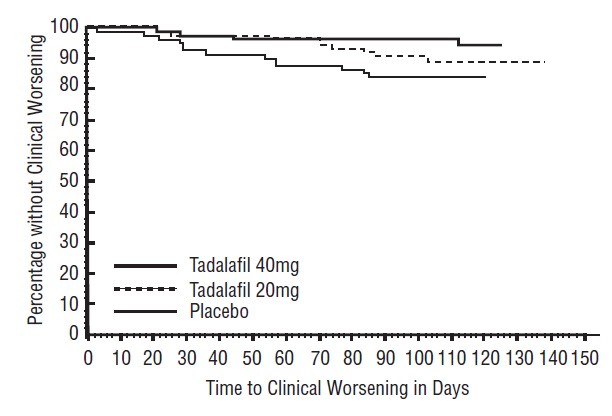
Figure 6 (Tadliq Fig6 V1)

Figure 6 (Tadliq Fig6 V1)
A Kaplan-Meier curve chart showing the percentage of subjects without clinical worsening over time in days. The chart compares three groups: Tadalafil 40 mg, Tadalafil 20 mg, and placebo, with the y-axis representing the percentage without clinical worsening and the x-axis representing time to clinical worsening in days.*

* About these descriptions: Image descriptions on this page are generated by automated AI analysis of the product label images from the manufacturer's FDA label submission (SPL). They are provided for reference only and may contain errors or omissions. Always rely on the printed label itself and the official FDA labeling, and consult a pharmacist or healthcare professional with any questions about this product.