Duloxetine Hydrochloride
Product Images NDC 46708-128

9 FDA label images from Alembic Pharmaceuticals Limited · Packaging, Regulatory Labels, and Product Appearance

Product Visual Gallery

This gallery contains 9 technical images submitted to the FDA as part of the official labeling for Duloxetine Hydrochloride (NDC 46708-128). Unlike standard consumer photos, these assets often include clinical data figures, molecular chemical structures, and official manufacturer packaging layouts.

As provided by Alembic Pharmaceuticals Limited, these visuals offer a comprehensive scientific overview of the product's physical and chemical identity, aiding pharmacists and researchers in product verification and study.

FDA Label Image

20mg Hdpe Bottle Pack (Duloxetine 20)

20mg Hdpe Bottle Pack (Duloxetine 20)
Label of Duloxetine Delayed-release Capsules USP, 20 mg, showing the product name, dosage form, and strength. The label includes directions for pharmacists, a barcode, and manufacturing information for Alembic Pharmaceuticals Limited. It states the capsule contains 22.4 mg of duloxetine hydrochloride USP equivalent to 20 mg duloxetine. The package contains 30 capsules.*
FDA Label Image

30mg Hdpe Bottle Pack (Duloxetine 30)

30mg Hdpe Bottle Pack (Duloxetine 30)
Label for Duloxetine Delayed-release Capsules USP, 30 mg, manufactured by Alembic Pharmaceuticals Limited. The label includes a barcode, dosage strength, quantity of 30 capsules, storage instructions, and a warning not to use if the inner seal is missing or broken. The product is intended for pharmacist dispensing with an accompanying medication guide.*
FDA Label Image

60mg Hdpe Bottle Pack (Duloxetine 60)

60mg Hdpe Bottle Pack (Duloxetine 60)
Label for Duloxetine Delayed-release Capsules USP, 60 mg, showing NDC 46708-130-30. The label includes storage instructions, manufacturer details (Alembic Pharmaceuticals Limited), and warnings about the capsule's inner seal. The packaging contains 30 capsules. The label also displays a barcode and pharmacist dispensing instructions.*
FDA Label Image

Duloxetine-figure-1 (Duloxetine Figure 1)

Duloxetine-figure-1 (Duloxetine Figure 1)
A line graph showing the percentage of patients improved based on percent improvement in pain from baseline. Four groups are compared: Duloxetine 60 mg twice daily, Duloxetine 60 mg once daily, Duloxetine 20 mg once daily, and placebo. The x-axis shows percent improvement in pain, and the y-axis shows percentage of patients improved.*
FDA Label Image

Duloxetine-figure-2 (Duloxetine Figure 2)

Duloxetine-figure-2 (Duloxetine Figure 2)
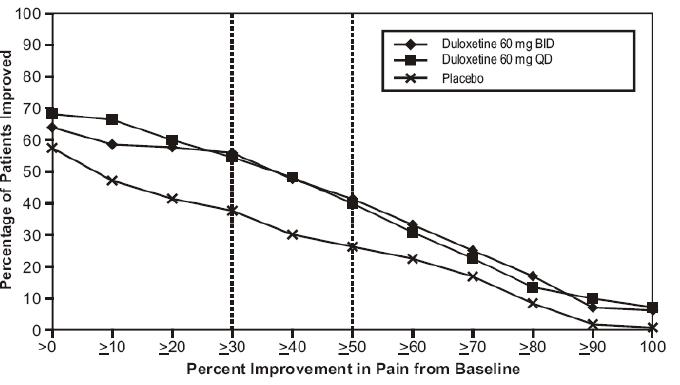
A line graph comparing the percentage of patients improved versus percent improvement in pain from baseline. Three lines represent Duloxetine 60 mg BID, Duloxetine 60 mg QD, and placebo, showing patient improvement percentages across different pain improvement thresholds.*
FDA Label Image

Figure-3 (Duloxetine Figure 3)

Figure-3 (Duloxetine Figure 3)
A line graph comparing the percentage of patients improved in pain from baseline (BOCF) between Duloxetine 60/120 mg once daily and placebo groups. The x-axis shows percent improvement in pain from 0 to 100%, and the y-axis shows the percentage of patients improved from 0 to 100%. Duloxetine shows a higher percentage of patients improved across most improvement levels compared to placebo.*
FDA Label Image

Figure-4 (Duloxetine Figure 4)

Figure-4 (Duloxetine Figure 4)
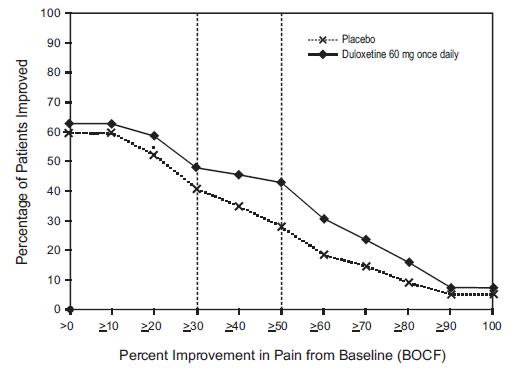
A line graph comparing the percentage of patients improved between Duloxetine 60 mg once daily and placebo groups. The X-axis represents percent improvement in pain from baseline (BOCF) ranging from >0 to 100%, while the Y-axis shows the percentage of patients improved from 0 to 100%. Two vertical dashed lines mark specific points on the X-axis to highlight data comparisons.*
FDA Label Image

Figure-5 (Duloxetine Figure 5)

Figure-5 (Duloxetine Figure 5)
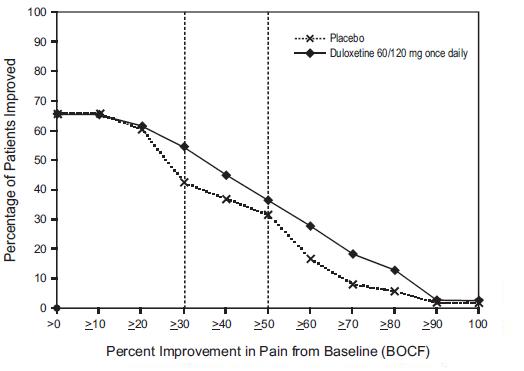
A line graph comparing the percentage of patients improved versus the percent improvement in pain from baseline (BOCF) between placebo and Duloxetine 60/120 mg once daily. The graph shows two lines: a dashed line for placebo and a solid line for Duloxetine, illustrating patient improvement trends over a range of pain improvement percentages from >0 to 100%.*
FDA Label Image

Duloxetine-structure (Duloxetine Structure)

Duloxetine-structure (Duloxetine Structure)
Chemical structure diagram of duloxetine hydrochloride, showing its molecular framework including thiophene, naphthalene, and amine hydrochloride groups as part of the active ingredient duloxetine hydrochloride.*

* About these descriptions: Image descriptions on this page are generated by automated AI analysis of the product label images from the manufacturer's FDA label submission (SPL). They are provided for reference only and may contain errors or omissions. Always rely on the printed label itself and the official FDA labeling, and consult a pharmacist or healthcare professional with any questions about this product.