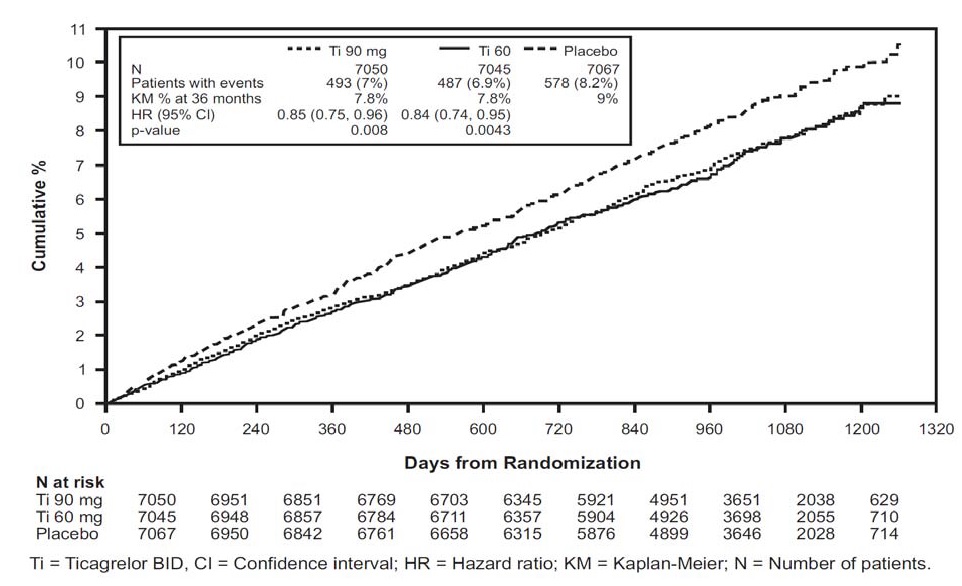
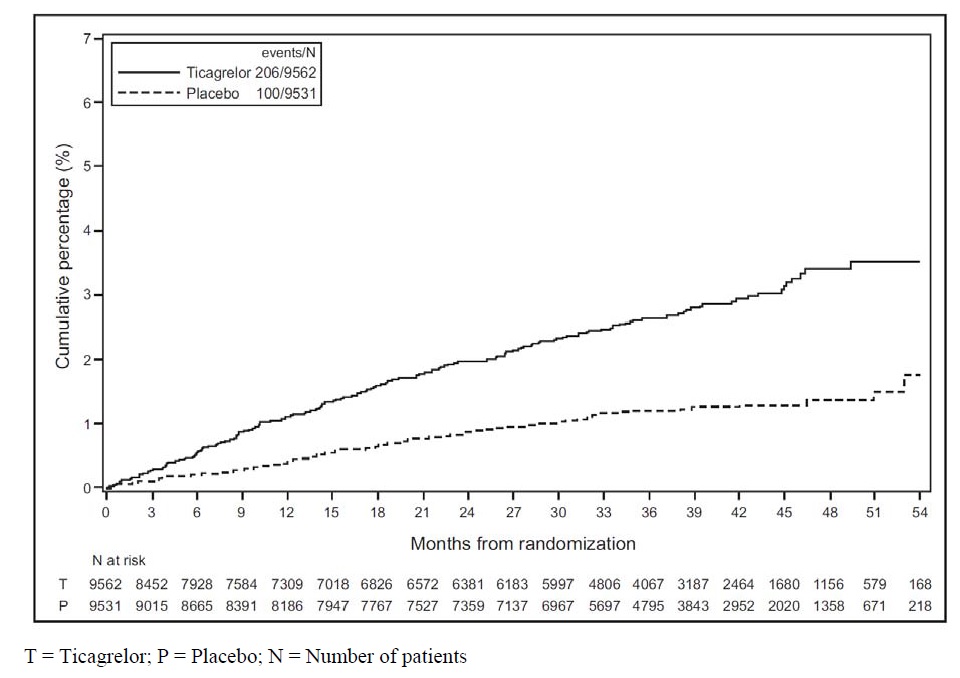
Product Images Ticagrelor
View Photos of Packaging, Labels & Appearance
- figure 10 - ticagrelor 10figure
- figure 11 - ticagrelor 11figure
- figure 12 - ticagrelor 12figure
- figure 13 - ticagrelor 13figure
- figure 14 - ticagrelor 14figure
- figure 15 - ticagrelor 15figure
- figure 16 - ticagrelor 16figure
- figure 17 - ticagrelor 17figur
- figure 18 - ticagrelor 18figur
- figure 1 - ticagrelor 1figure
- figure 2 - ticagrelor 2figure
- figure 3 - ticagrelor 3figure
- figure 4 - ticagrelor 4figure
- figure 5 - ticagrelor 5figure
- figure 6 - ticagrelor 6figure
- figure 7 - ticagrelor 7figure
- figure 8 - ticagrelor 8fig
- 30 tablets - ticagrelor 90 mg
- figure 9 - ticagrelor figure 9
- structure - ticagrelor structure
Product Label Images
The following 20 images provide visual information about the product associated with Ticagrelor NDC 46708-241 by Alembic Pharmaceuticals Limited, such as packaging, labeling, and the appearance of the drug itself. This resource could be helpful for medical professionals, pharmacists, and patients seeking to verify medication information and ensure they have the correct product.
figure 10 - ticagrelor 10figure

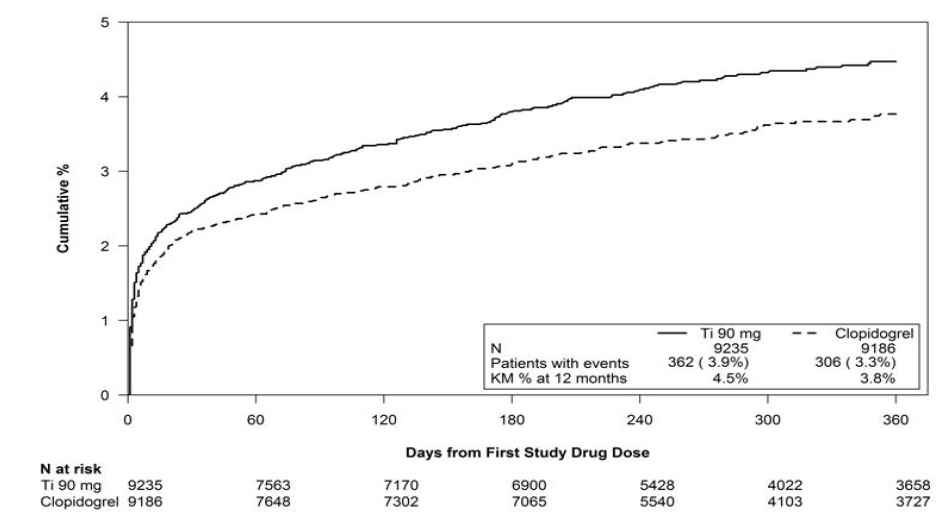
This is a comparison study between two groups of patients, one taking Ticlopidine and the other taking Clopidogrel. The study measures the occurrence of events in the two groups over a 12-month period. The results show that 9.3% of patients on Ticlopidine and 10.9% of patients on Clopidogrel experienced events. The Kaplan-Meier percentage at 12 months was 9.8% for Ticlopidine and 11.7% for Clopidogrel. The Hazard Ratio (HR) was calculated to be 0.84 with a 95% confidence interval of (0.77, 0.92). The p-value was found to be 0.0003, indicating a statistically significant difference between the two groups. The study also provides the number of patients at risk on different time points from randomization.*
figure 11 - ticagrelor 11figure

The text presents data on a study's characteristics, including treatment effects, patient demographics such as age, sex, and race, as well as treatment approaches, drug comparison results, and statistical values like HR (Hazard Ratio) with 95% CI (Confidence Interval). Key points include variables like geographic region distribution, ASA dose levels, treatment approach choices, diabetic history, and medication usage. The study also delves into specific details such as the use of Ticagrelor versus Clopidogrel and related outcomes. The data is detailed and encompasses various important factors for analysis.*
figure 14 - ticagrelor 14figure

The provided text seems to show information related to clinical trial data, including characteristics of the participants such as age groups, sex, weight group, medical history, and treatment efficacy. The text also provides details on the outcomes related to the drug Ticagrelor compared to Placebo. It showcases various statistics and percentages based on different parameters such as age, gender, race, weight, and medical history. The data includes percentages of participants falling into specific categories and the treatment outcomes in terms of Hazard Ratios (HR) with their corresponding 95% Confidence Intervals. The document appears to present detailed results from a research study evaluating the effects of Ticagrelor in comparison to Placebo in a specific patient population, potentially providing valuable insights for healthcare professionals and researchers.*
figure 15 - ticagrelor 15figure

This is a table showing the number of events for Ticagrelor and Placebo treatment groups over 54 months after randomization. The number of patients at risk for each group is also indicated at various time points. The data indicates the outcomes and patient numbers for both treatments over the 54-month study period.*
figure 16 - ticagrelor 16figure

The text seems to be detailing a clinical study comparing the efficacy of Ticagrelor versus Placebo in various subgroups based on characteristics such as age, gender, race, body mass index, geographic region, aspirin dose, HbA1c levels, eGFR, insulin use, history of angina, and other factors. The study includes hazard ratios with 95% confidence intervals for different parameters. Ultimately, it concludes that Ticagrelor performed better than Placebo based on the provided data.*
figure 18 - ticagrelor 18figur

This is a comparison study between Ticagrelor and Placebo in patients at risk for cardiovascular events. The study evaluates various characteristics such as age, sex, race, weight, BMI, geographic region, diagnosis, time from event to randomisation, presence of diabetes, hypertension, prior history of stroke, heart disease, ASA use, statin treatment, and smoking status. The data includes hazard ratios and confidence intervals for each characteristic, comparing the effectiveness of Ticagrelor to Placebo.*
figure 1 - ticagrelor 1figure

The provided text appears to be a comparison of the efficacy of Ticagrelor (Ti90 mg) and Clopidogrel in patients with events over 12 months. It shows the percentage of patients with events at 3.9% for Ticagrelor and 3.3% for Clopidogrel. The Kaplan-Meier percentages at 12 months were 4.5% for Ticagrelor and 3.8% for Clopidogrel. The data is presented over a 360-day period from the first study drug dose with the number of patients at risk for each drug at different time points.*
figure 3 - ticagrelor 3figure

This is a tabular representation for a clinical trial evaluating ticagrelor, where the number of patients on ticagrelor and placebo is provided at various time points during the study. It shows the cumulative percentage of patients remaining in the study over months from randomization. The table includes the number of patients at risk for each medication group (Ticagrelor and Placebo) at different time points during the trial.*
figure 4 - ticagrelor 4figure

This is a descriptive chart showing the cumulative percentage of events over time for a study comparing ticagrelor 90mg bd versus placebo. Ticagrelor is shown to have a higher cumulative percentage of events compared to placebo over the duration of the study. The x-axis represents the days from randomization while the y-axis represents the cumulative percentage of events.*
figure 5 - ticagrelor 5figure

This description provides information about the level of inhibition of IPA induced by 20uM ADP after administration of Ticagrelor 180 mg and Clopidogrel 600 mg over a period of time in hours. It seems to be a data chart or table presenting the results of an experiment or study on antiplatelet effects of these medications.*
figure 6 - ticagrelor 6figure

This is a data table showing the IPA (%) induced by 20uM ADP over a period of time (measured in days) for Ticagrelor, Clopidogrel, and Placebo. The data is presented in the table with two columns labeled A and B, with Ticagrelor having a 100% inhibition of platelet aggregation at Day 4.*
figure 7 - ticagrelor 7figure

This document provides information on the mean effect and 90% confidence interval of Ticagrelor (AR-G124910XX) across various intrinsic factors such as age, gender, ethnicity, renal impairment, end-stage renal disease, and hepatic impairment. The recommendations for dose adjustment based on these factors are also included. Additionally, it mentions that Ticagrelor has not been studied in patients with moderate or severe hepatic impairment.*
figure 9 - ticagrelor figure 9

This text provides information on interacting drugs with varying doses of Ticagrelor and their effects, along with recommendations for interactions with other medications such as Simvastatin, Atorvastatin, Levonorgestrel, Ethinyl Estradiol, Tolbutamide, Digoxin, and Cyclosporine. It also includes notes on dose adjustments and monitoring levels for certain drugs. The maximum dose for Simvastatin is recommended at 40 mg.*
* The product label images have been analyzed using a combination of traditional computing and machine learning techniques. It should be noted that the descriptions provided may not be entirely accurate as they are experimental in nature. Use the information in this page at your own discretion and risk.