Memantine Hydrochloride Tablet, Coated
Product Images NDC 46708-451

View Photos of Packaging, Regulatory Labels, and Product Appearance

Product Visual Gallery

This gallery contains 11 technical images submitted to the FDA as part of the official labeling for Memantine Hydrochloride (NDC 46708-451). Unlike standard consumer photos, these assets often include clinical data figures, molecular chemical structures, and official manufacturer packaging layouts.

As provided by Alembic Pharmaceuticals Limited, these visuals offer a comprehensive scientific overview of the product's physical and chemical identity, aiding pharmacists and researchers in product verification and study.

FDA Label Image

60 Tablets In 1 Hdpe Bottle (Memantine 10mg)

60 Tablets In 1 Hdpe Bottle (Memantine 10mg)
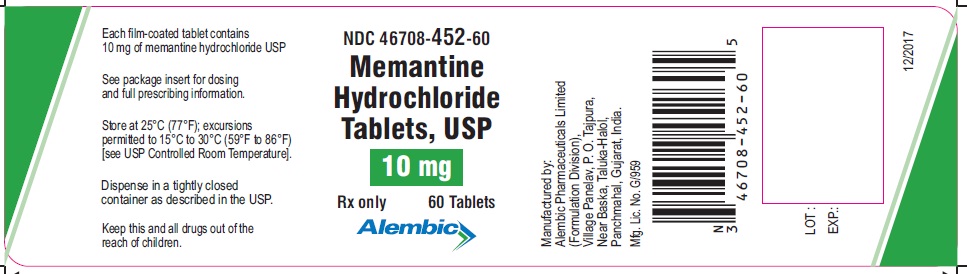
This is the packaging information for Ezchfim-coated tablets of Memantine Hydrochloride USP containing 10mg. The tablets should be stored at a temperature of 25°C with excursions permitted to 15°C or 0°C. It is recommended to dispense the tablets in a tightly closed container. This medication should be kept away from children. The packaging contains an NDC code of 46708-452-60 for 60 tablets produced by Alembic Pharmaceuticals Ltd in Gujarat, India. The packaging also includes lot number and expiration date information.*
FDA Label Image

60 Tablets In 1 Hdpe Bottle (Memantine 5mg)

60 Tablets In 1 Hdpe Bottle (Memantine 5mg)
This is a description of a medication containing 5mg of memantine hydrochloride. It is recommended to be stored at 25°C with permissible excursions to 15°C or 0°C. The medication should be kept in a tightly closed container as described in USP and out of reach of children. The NDC is 46708-451-60, and the medication is available in 60 tablets. The rest of the text is not readable.*
FDA Label Image

Figure 1 (Memantine Fig1)

Figure 1 (Memantine Fig1)
This text reports the time course of the change from baseline in ADCS-ADL score for patients who completed 28 weeks of treatment with Memantine Hydrochloride. The mean (+SEM) range is provided, as well as a figure showing the clinical improvement or decline in the patients.*
FDA Label Image

Figure 2 (Memantine Fig2)

Figure 2 (Memantine Fig2)
This is a graph representation showing the cumulative percentage of patients who completed a 28-week double-blind treatment. The changes from baseline in the ADCS-ADL scores are depicted on the x-axis, while the percentage of patients is represented on the y-axis.*
FDA Label Image

Figure 4 (Memantine Fig4)

Figure 4 (Memantine Fig4)
The text appears to be a figure caption from a medical study. It includes a graph showing the percentage of patients with specified changes from baseline in SIB (Severe Impairment Battery) scores after 28 weeks of double-blind treatment. The text also includes the names of two substances: "placebo" and "memartino hydrochloride".*
FDA Label Image

Figure 6 (Memantine Fig6)

FDA Label Image

Figure 7 (Memantine Fig7)

FDA Label Image

Figure 8 (Memantine Fig8)

Figure 8 (Memantine Fig8)
This text appears to be a figure caption detailing a graph. It displays the percentage of patients who have completed 24 weeks of treatment and the specific changes in SIB (Severe Impairment Battery) scores from baseline in Alzheimer's disease patients. The figure depicts a comparison between two drugs - Donepezil and Memantine hydrochloride. The rest of the text may be related to the graph axes or labels, but it is not available to provide a complete understanding.*
FDA Label Image

Figure 3 (Memantine Figure3)

Figure 3 (Memantine Figure3)
This is a report of a study that measured the change in SIB (Severe Impairment Battery) score for patients who completed 28 weeks of treatment with a drug called Memantine hydrochloride. The mean change was plotted in a time-course graph over the 28 weeks.*
FDA Label Image

Figure 5 (Memantine Figure5)

Figure 5 (Memantine Figure5)
This text presents a graph (Figure 5) showing the time course of the change from baseline in ADCS-ADL score for patients completing 24 weeks of treatment. The graph illustrates the mean (±SEM) change from baseline at 0, 2, 4, and 8 months of treatment. There is a label indicating "Weeks of Treatment" on the X-axis and "ADCS-ADL Score" on the Y-axis.*
FDA Label Image

Structure (Memantine Structure)

* These product label images have been analyzed using experimental machine learning. Please verify findings with the primary label text.