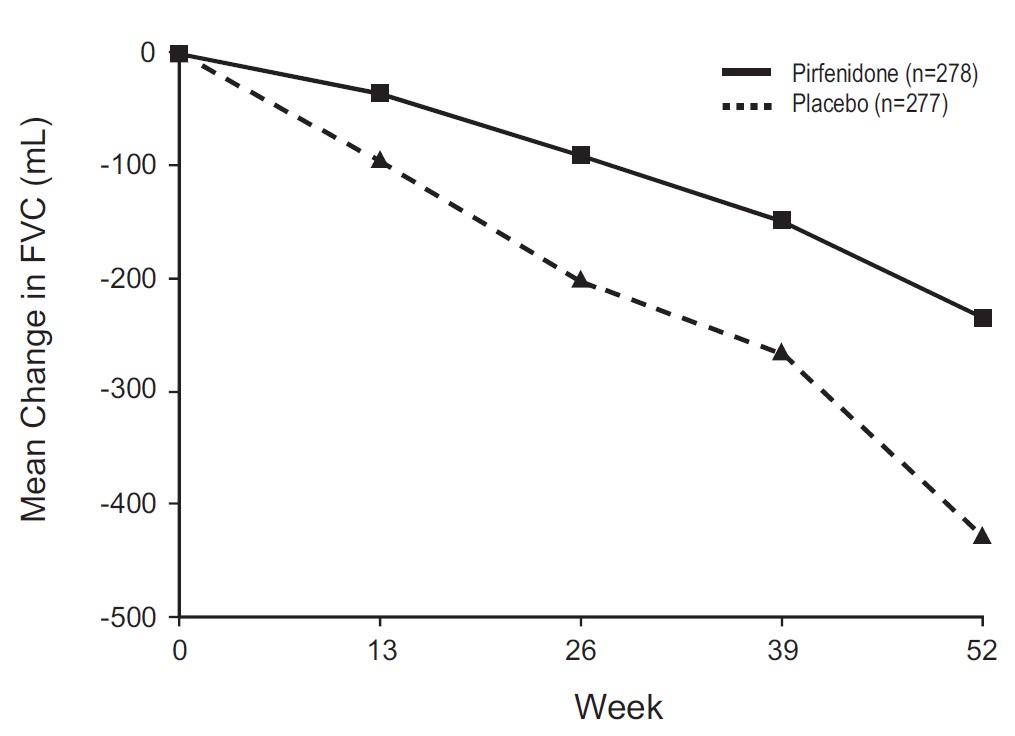
Figure 1 (Pirfenidone Figure1)
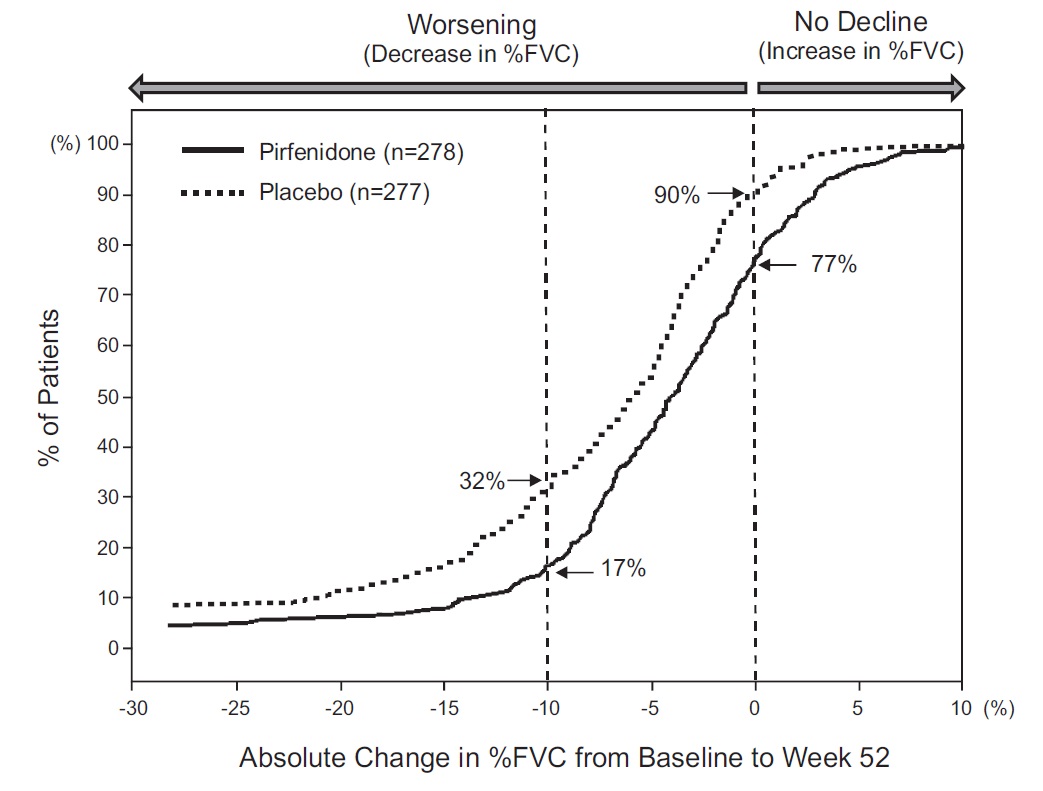
The text describes a chart or graph presenting data on the percentage of patients experiencing worsening or no decline in %FVC (forced vital capacity) over a 52-week period. The chart is divided into categories of %FVC decline, ranging from 10% to 90+%. Two groups, Pirfenidone and Placebo, are being compared, with the number of participants in each group (278 and 277, respectively) noted. The only available data point shown in the chart is the absolute change in %FVC from baseline to week 52, which is labeled as a 10% increase.*