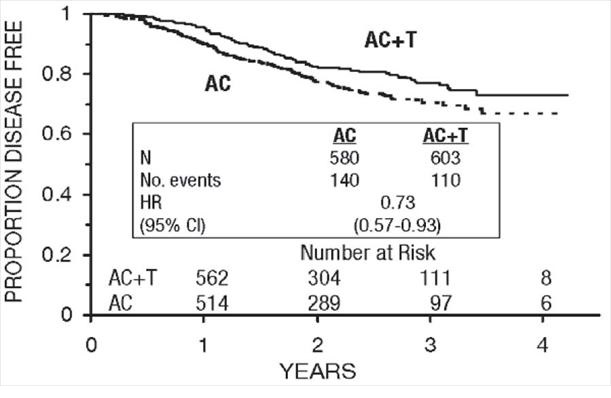
Paclitaxel-1figure (Paclitaxel 1figure)
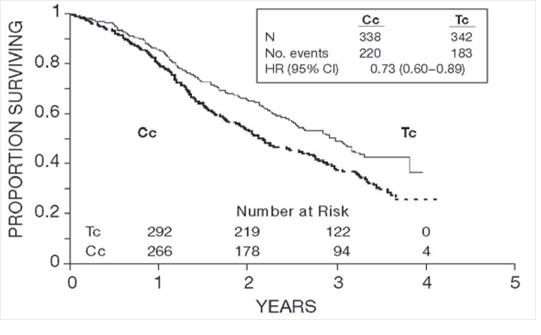
This appears to be a survival analysis table that shows the proportion surviving over time. The table has four rows for each year (1-4 years), with columns listing the number at risk for each group (T, C, and 0), the number of events, and the hazard ratio with 95% confidence interval. Unfortunately, without more context or information about the study, it is difficult to interpret the results.*