Docetaxel Injection
Product Images NDC 46708-678

View Photos of Packaging, Regulatory Labels, and Product Appearance

Product Visual Gallery

This gallery contains 17 technical images submitted to the FDA as part of the official labeling for Docetaxel (NDC 46708-678). Unlike standard consumer photos, these assets often include clinical data figures, molecular chemical structures, and official manufacturer packaging layouts.

As provided by Alembic Pharmaceuticals Limited, these visuals offer a comprehensive scientific overview of the product's physical and chemical identity, aiding pharmacists and researchers in product verification and study.

FDA Label Image

Docetaxel-160mg-carton (Docetaxel 160mg Carton)
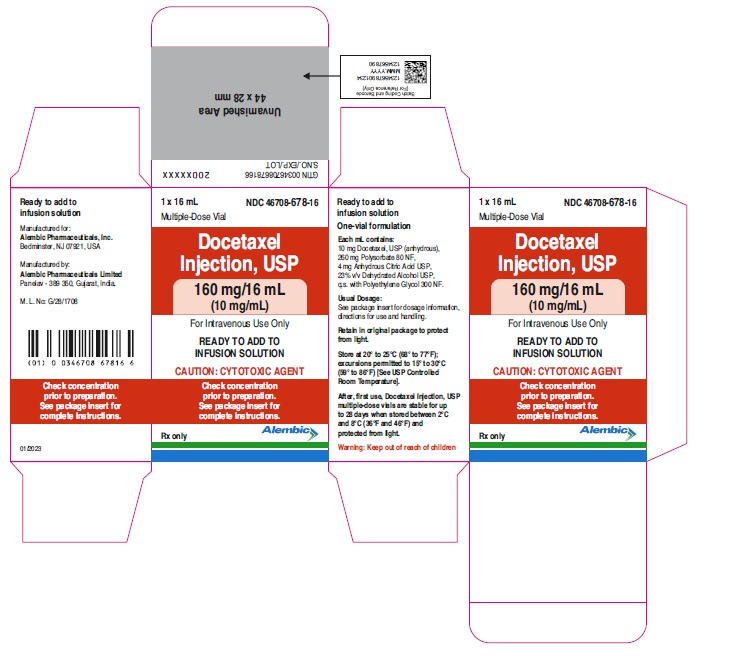
Docetaxel-160mg-carton (Docetaxel 160mg Carton)
Packaging label for Docetaxel Injection, USP 160 mg/16 mL (10 mg/mL) intravenous injection by Alembic Pharmaceuticals Limited. The carton indicates multiple-dose vials of 16 mL each, with a warning that the product is a cytotoxic agent and should be added to infusion solution. The label includes storage and handling instructions and cautions for use.*
FDA Label Image

Docetaxel-160mg-vial (Docetaxel 160mg Vial)

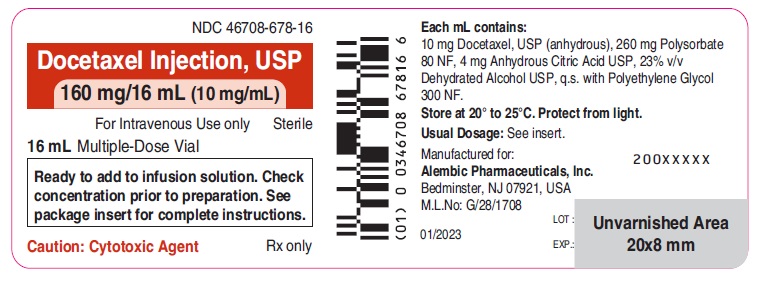
Docetaxel-160mg-vial (Docetaxel 160mg Vial)
Label for Docetaxel Injection, USP 160 mg/16 mL (10 mg/mL) multidose vial for intravenous use, manufactured by Alembic Pharmaceuticals. The label includes dosage strength, usage instructions to add to infusion solution, caution as cytotoxic agent, storage conditions, and manufacturer details.*
FDA Label Image

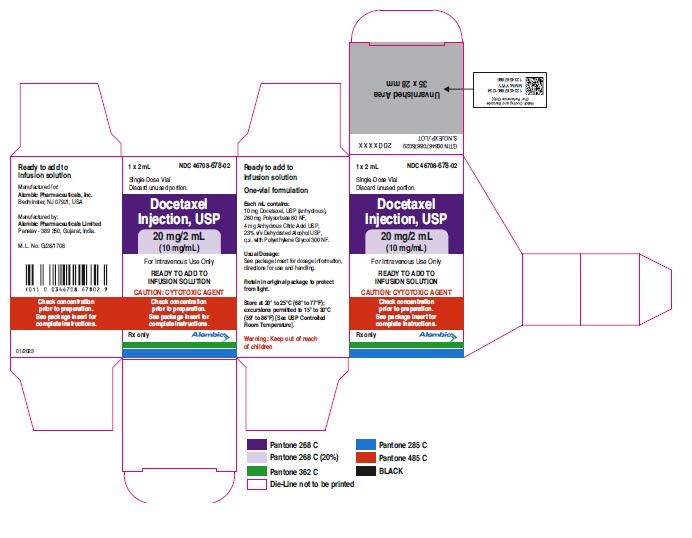
Docetaxel-20mg-carton (Docetaxel 20mg Carton)

Docetaxel-20mg-carton (Docetaxel 20mg Carton)
Packaging label for Docetaxel Injection, USP 20 mg/2 mL (10 mg/mL) single-dose vial for intravenous use. The label states it is a ready-to-add-to-infusion solution and a cytotoxic agent. Manufactured by Alembic Pharmaceuticals Limited, it includes dosing and storage instructions, warnings to keep out of reach of children, and a barcode. The label features purple, black, blue, red, and green colors with a clean, clinical design.*
FDA Label Image

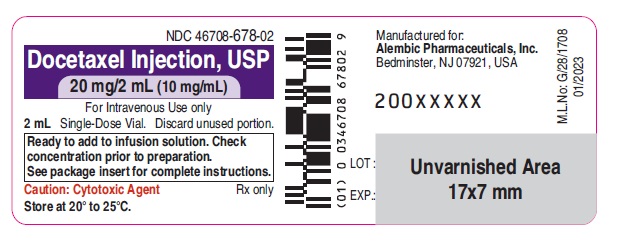
Docetaxel-20mg-vial (Docetaxel 20mg Vial)

Docetaxel-20mg-vial (Docetaxel 20mg Vial)
Label for Docetaxel Injection, USP 20 mg/2 mL (10 mg/mL) intravenous injection by Alembic Pharmaceuticals Limited. It is a 2 mL single-dose vial with caution indicating cytotoxic agent. Instructions note it is ready to add to infusion solution and to check concentration prior to preparation.*
FDA Label Image

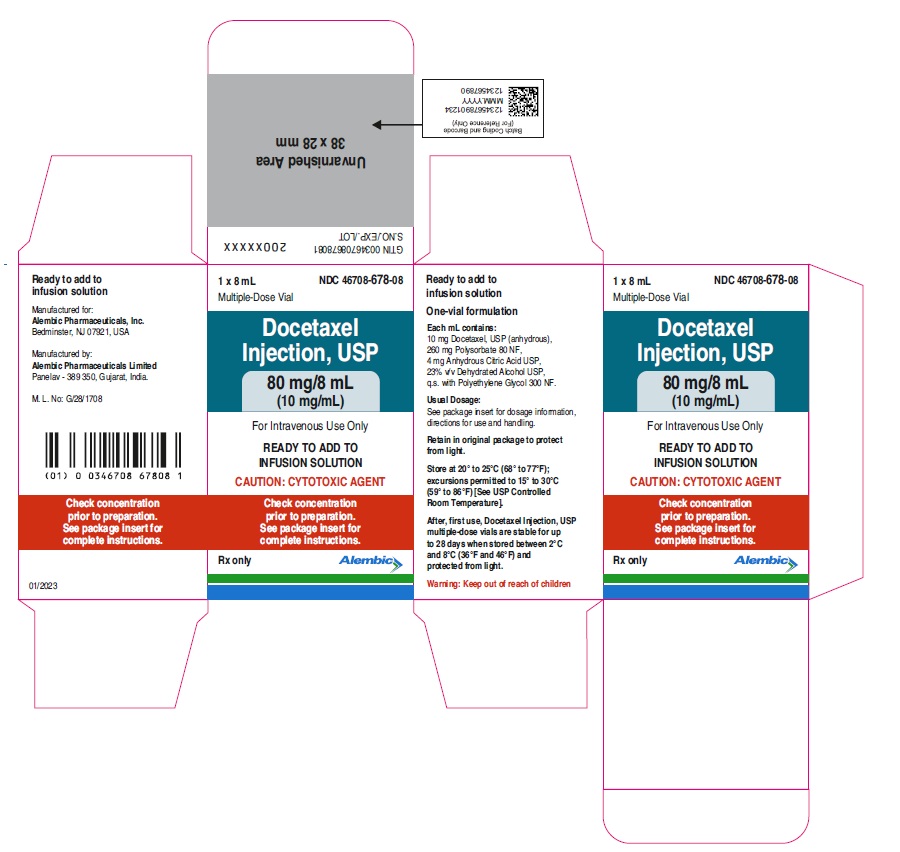
Docetaxel-80mg-carton (Docetaxel 80mg Carton)

Docetaxel-80mg-carton (Docetaxel 80mg Carton)
Packaging label for Docetaxel Injection, USP 80 mg/8 mL (10 mg/mL) multiple-dose vial by Alembic Pharmaceuticals Limited. The label shows dosage form as intravenous injection and includes instructions to add to infusion solution and warnings about cytotoxicity. The NDC is 46708-678-08. Storage and handling information is provided, with emphasis on protecting from light and storing at controlled room temperature.*
FDA Label Image

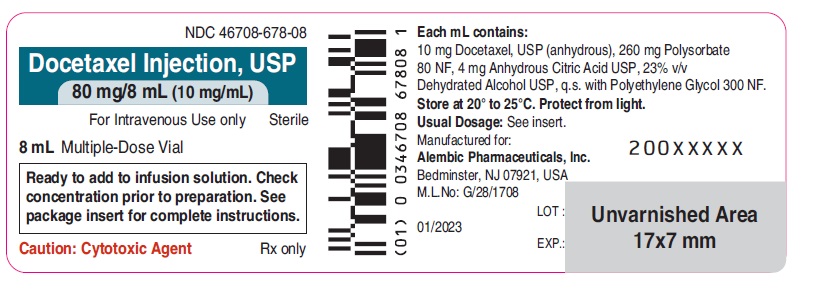
Docetaxel-80mg-vial (Docetaxel 80mg Vial)

Docetaxel-80mg-vial (Docetaxel 80mg Vial)
Docetaxel Injection, USP 80 mg/8 mL (10 mg/mL) sterile intravenous injection in an 8 mL multiple-dose vial. The label notes it is for infusion solution preparation, marks it as a cytotoxic agent, and lists Alembic Pharmaceuticals, Inc. as the manufacturer. It includes storage instructions and active ingredient concentrations.*
FDA Label Image

Docetaxel-figure-1 (Docetaxel Figure 1)

Docetaxel-figure-1 (Docetaxel Figure 1)
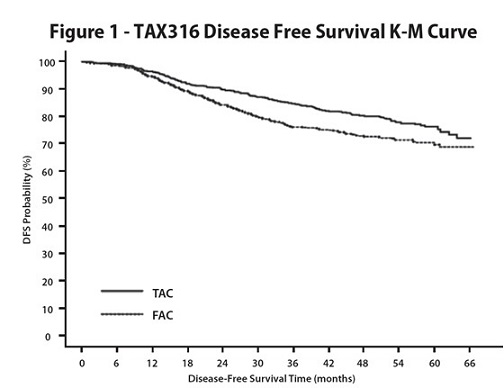
A Kaplan-Meier curve showing Disease-Free Survival (DFS) probability over time in months for two groups labeled TAC and FAC. The graph depicts the changes in DFS probability percentage from 0 to 100 over approximately 66 months, illustrating comparative survival trends for the two groups.*
FDA Label Image

Docetaxel-figure-10 (Docetaxel Figure 10)

Docetaxel-figure-10 (Docetaxel Figure 10)
A Kaplan-Meier survival curve titled 'Figure 10 - TAX324 Overall Survival K-M Curve' showing overall survival probability (%) over time in months for two groups, TPF (solid line) and PF (dotted line). The graph includes numbers of patients at risk at various time points for each group, illustrating survival trends up to 72 months.*
FDA Label Image

Docetaxel-figure-2 (Docetaxel Figure 2)

Docetaxel-figure-2 (Docetaxel Figure 2)
A Kaplan-Meier survival curve titled 'TAX316 Overall Survival K-M Curve' comparing survival probability (%) over time in months between two groups labeled TAC (solid line) and FAC (dashed line). The vertical axis shows survival probability from 0% to 100%, and the horizontal axis shows survival time from 0 to 66 months.*
FDA Label Image

Docetaxel-figure-3 (Docetaxel Figure 3)

Docetaxel-figure-3 (Docetaxel Figure 3)
A Kaplan-Meier survival curve comparing Docetaxel 75 mg/m² intravenous injection to Best Supportive Care over survival time in months. The chart shows cumulative probability of survival with two plotted lines labeled T75 and BSC, indicating higher survival probability for Docetaxel. Statistical significance is noted with a log-rank p-value of 0.010.*
FDA Label Image

Docetaxel-figure-4 (Docetaxel Figure 4)

Docetaxel-figure-4 (Docetaxel Figure 4)
A Kaplan-Meier survival curve chart comparing overall survival for Docetaxel 75 mg/m² versus Vinorelbine or Ifosfamide control. The x-axis represents survival time in months up to 21 months, and the y-axis shows cumulative probability from 0.0 to 1.0. Two curves are displayed, with a Log-rank p value of 0.13 indicated.*
FDA Label Image

Docetaxel-figure-5 (Docetaxel Figure 5)

Docetaxel-figure-5 (Docetaxel Figure 5)
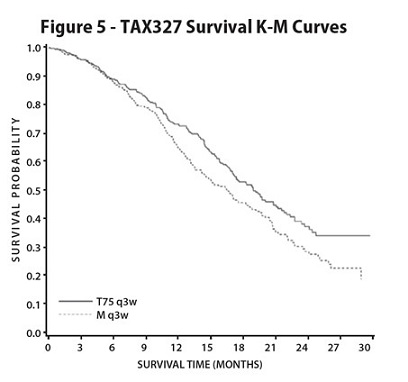
A Kaplan-Meier survival curve chart titled 'Figure 5 - TAX327 Survival K-M Curves' displaying survival probability over time in months. The graph shows two survival curves labeled T75 q3w (solid line) and M q3w (dotted line), illustrating survival probabilities decreasing from 1.0 to approximately 0.3 over a 30-month period.*
FDA Label Image

Docetaxel-figure-6 (Docetaxel Figure 6)

Docetaxel-figure-6 (Docetaxel Figure 6)
A Kaplan-Meier curve illustrating time to progression in months for gastric cancer patients in the TAX325 study. The y-axis shows probability percentage, and two treatment groups, TCF and CF, are compared over a 24-month period.*
FDA Label Image

Docetaxel-figure-7 (Docetaxel Figure 7)

Docetaxel-figure-7 (Docetaxel Figure 7)
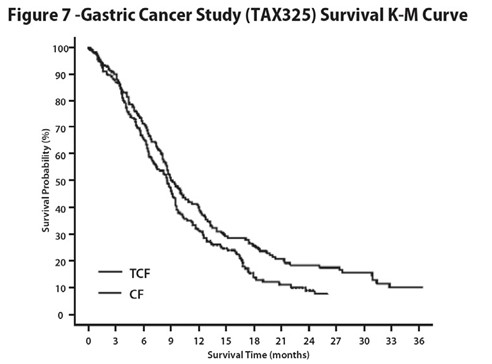
A Kaplan-Meier survival curve from a gastric cancer study (TAX325) showing survival probability (%) over survival time in months (0 to 36). Two treatment groups, TCF and CF, are represented by separate lines, illustrating differences in survival rates over time.*
FDA Label Image

Docetaxel-figure-8 (Docetaxel Figure 8)

Docetaxel-figure-8 (Docetaxel Figure 8)
A Kaplan-Meier curve illustrating progression-free survival probability over time in months. The graph compares two treatment groups, TPF and PF, showing decreasing progression-free survival percentages as time progresses up to 42 months.*
FDA Label Image

Docetaxel-figure-9 (Docetaxel Figure 9)

Docetaxel-figure-9 (Docetaxel Figure 9)
A Kaplan-Meier overall survival curve graph titled 'Figure 9-TAX323 Overall Survival K-M Curve' showing survival probability (%) over survival time in months. Two survival lines compare TPF and PF treatment groups, depicting changes in survival probability from 0 to 72 months.*
FDA Label Image

Docetaxel-structure (Docetaxel Structure)

Docetaxel-structure (Docetaxel Structure)
Chemical structure of Docetaxel, illustrating its complex multi-ring molecular framework with hydroxyl, ester, and aromatic functional groups, consistent with its designation as an active pharmaceutical ingredient.*

* About these descriptions: Image descriptions on this page are generated by automated AI analysis of the product label images from the manufacturer's FDA label submission (SPL). They are provided for reference only and may contain errors or omissions. Always rely on the printed label itself and the official FDA labeling, and consult a pharmacist or healthcare professional with any questions about this product.