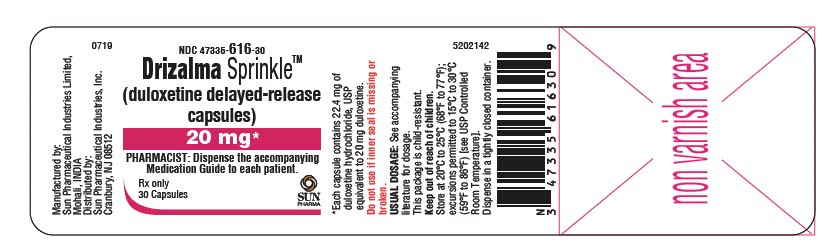
60 mg (B41423b8 Dfec 4d79 Ba3c E43a87803d85 00)

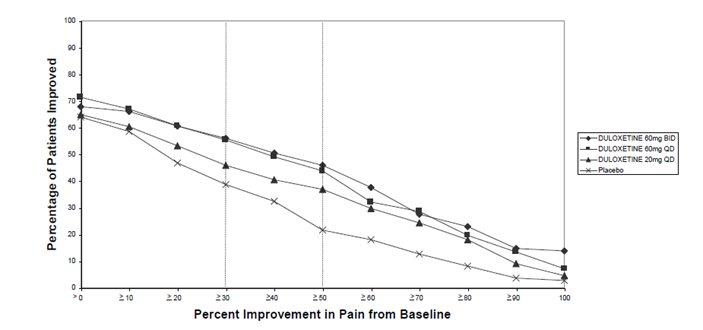
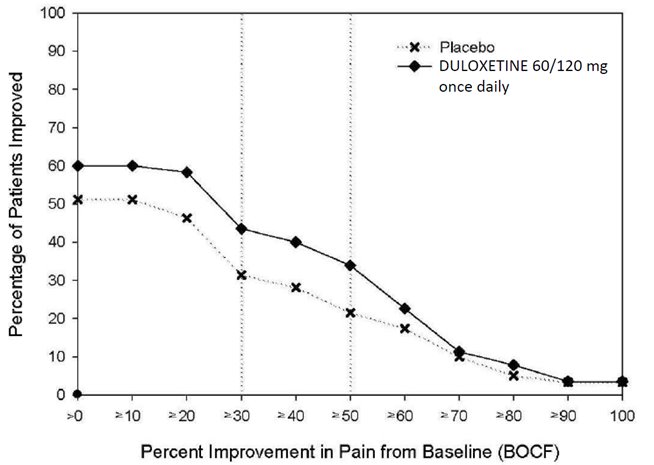
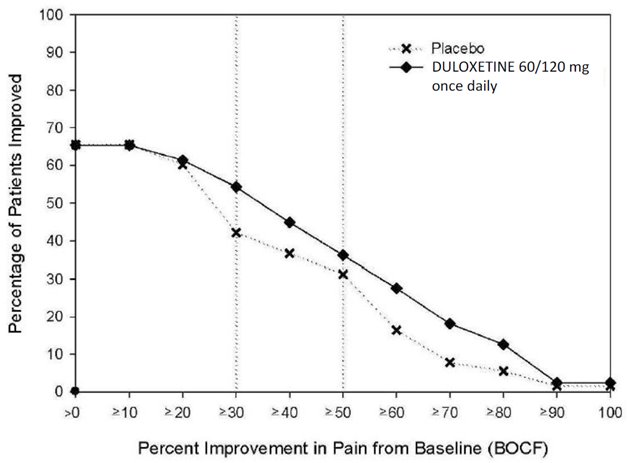
This gallery contains 14 technical images submitted to the FDA as part of the official labeling for Drizalma Sprinkle (NDC 47335-618). Unlike standard consumer photos, these assets often include clinical data figures, molecular chemical structures, and official manufacturer packaging layouts.
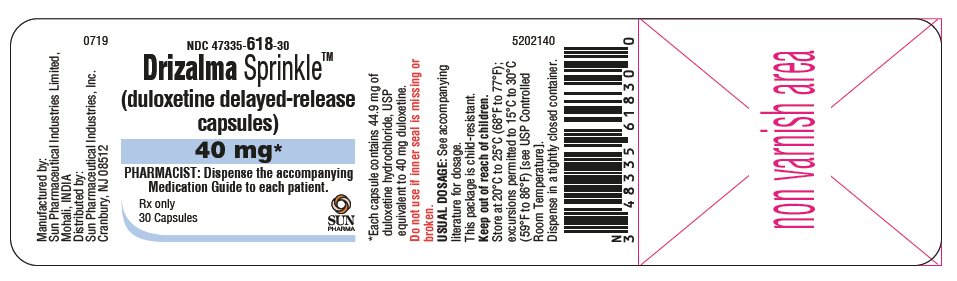
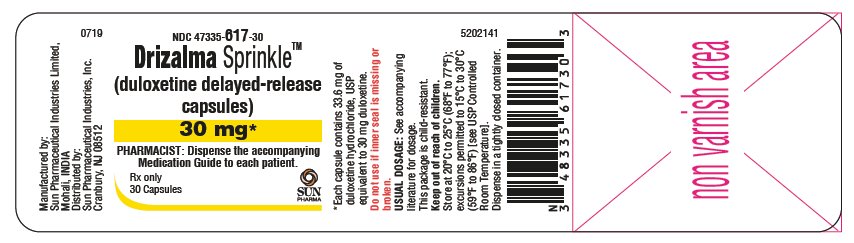
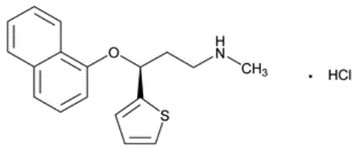
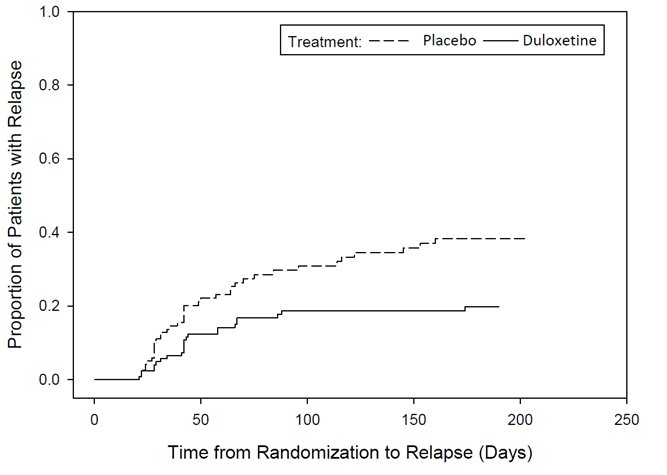
As provided by Sun Pharmaceutical Industries, Inc., these visuals offer a comprehensive scientific overview of the product's physical and chemical identity, aiding pharmacists and researchers in product verification and study.


* These product label images have been analyzed using experimental machine learning. Please verify findings with the primary label text.