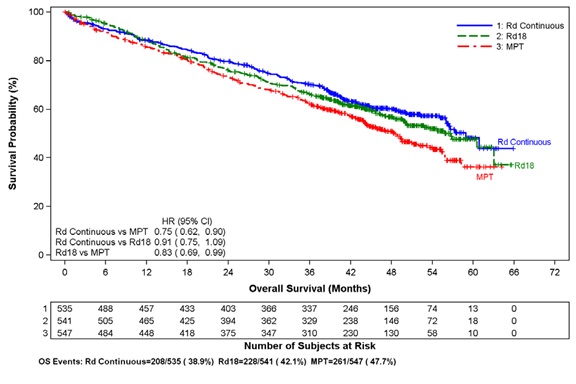
Figure-itt-mm-1 (Figure Itt Mm 1)
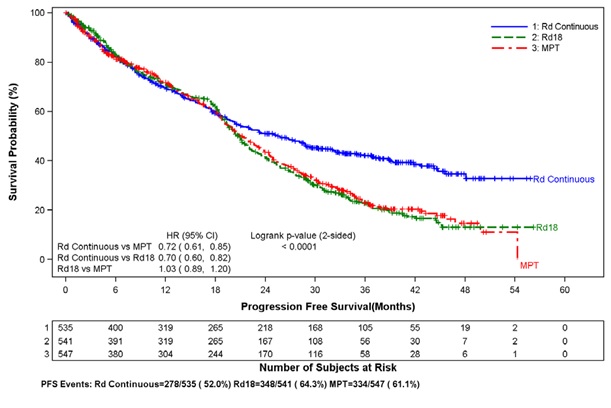
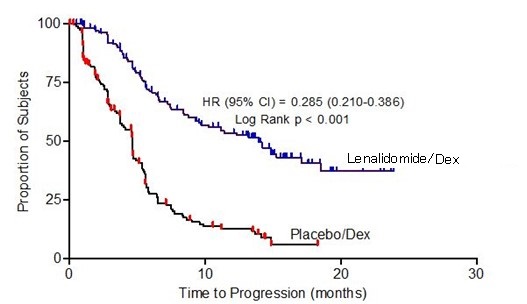
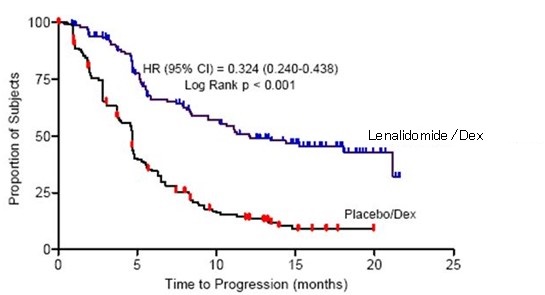
The text provides statistical data for the survival probability and progression-free survival in a clinical trial with three different treatments. The survival probability table shows a 100% probability and HR values with respective Logrank p-values for each treatment. The progression-free survival chart shows the number of subjects at risk and PFS events for each treatment, which are Rd Continuous, RATB, and MPT.*