Prempro
Product Images NDC 50090-0573

8 FDA label images from A-s Medication Solutions · Packaging, Regulatory Labels, and Product Appearance

Product Visual Gallery

This gallery contains 8 technical images submitted to the FDA as part of the official labeling for Prempro (NDC 50090-0573). Unlike standard consumer photos, these assets often include clinical data figures, molecular chemical structures, and official manufacturer packaging layouts.

As provided by A-s Medication Solutions, these visuals offer a comprehensive scientific overview of the product's physical and chemical identity, aiding pharmacists and researchers in product verification and study.

FDA Label Image

Label Image (Lbl500900573)

Label Image (Lbl500900573)
Prempro packaging label from A-S Medication Solutions, showing product NDC 50090-0573-0. The label includes information about the active ingredients conjugated estrogens and medroxyprogesterone acetate with specified strengths. It also provides storage instructions to keep the product between 68 to 77 degrees Fahrenheit and indicates the package contains 1 blister card of 28 tablets.*
FDA Label Image

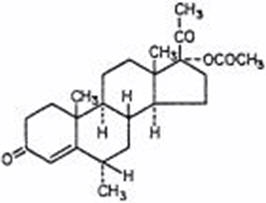
Chemical Structure (Prempro 01)

Chemical Structure (Prempro 01)
Chemical structure of the active ingredient in Prempro, showing a steroid backbone with various functional groups including ketones and methyl esters. The structure illustrates the detailed arrangement of carbon, hydrogen, and oxygen atoms typical of hormone-related compounds.*
FDA Label Image

Figure 1 (Prempro 02)

Figure 1 (Prempro 02)
A line graph showing the percentage of patients over 13 cycles comparing two groups labeled '0.625/2.5' and '0.625/5.0' with sample sizes of 340 and 338 respectively. The x-axis represents cycles from 1 to 13, and the y-axis represents the percentage of patients from 0% to 100%. Both groups show an increasing trend in percentage of patients over cycles, with the '0.625/2.5' group consistently having higher percentages.*
FDA Label Image

Figure 2 (Prempro 03)

Figure 2 (Prempro 03)
A line graph showing the percentage of patients on the y-axis and treatment cycles on the x-axis, depicting three groups with different CE/MPA dose levels: 0.625/2.5, 0.45/1.5, and 0.3/1.5, each with sample sizes around 327 to 331 patients. The graph illustrates how patient percentages increase over 13 cycles for each dose group.*
FDA Label Image

Figure 3 (Prempro 04)

Figure 3 (Prempro 04)
A cumulative percentage curve graph showing the percent change from baseline in spine bone mineral density (BMD) in subjects. The graph compares different treatment groups labeled with numerical values and includes a placebo for reference.*
FDA Label Image

Figure 4 (Prempro 05)

Figure 4 (Prempro 05)
A line graph showing adjusted percent change from baseline over multiple cycles (0, 6, 13, 19, 26) for four groups labeled with different dosage combinations and a placebo. The y-axis ranges from -4 to 5 percent change. Data points include error bars, and separate trend lines indicate different medication dosages compared to placebo.*
FDA Label Image

Logo (Prempro 06)

FDA Label Image

Prempro 06a

* About these descriptions: Image descriptions on this page are generated by automated AI analysis of the product label images from the manufacturer's FDA label submission (SPL). They are provided for reference only and may contain errors or omissions. Always rely on the printed label itself and the official FDA labeling, and consult a pharmacist or healthcare professional with any questions about this product.