Alendronate Sodium
Product Images NDC 50090-1095

11 FDA label images from A-s Medication Solutions · Packaging, Regulatory Labels, and Product Appearance

Product Visual Gallery

This gallery contains 11 technical images submitted to the FDA as part of the official labeling for Alendronate Sodium (NDC 50090-1095). Unlike standard consumer photos, these assets often include clinical data figures, molecular chemical structures, and official manufacturer packaging layouts.

As provided by A-s Medication Solutions, these visuals offer a comprehensive scientific overview of the product's physical and chemical identity, aiding pharmacists and researchers in product verification and study.

FDA Label Image

Arrow (Image 1)

Arrow (Image 1)
Chemical structure diagram of alendronate sodium showing its molecular arrangement including phosphonate groups attached to a central carbon atom.*
FDA Label Image

Arrow (Image 2)

Arrow (Image 2)
Chemical structure of alendronate sodium is shown, depicting the molecular diagram of the active ingredient alendronate sodium.*
FDA Label Image

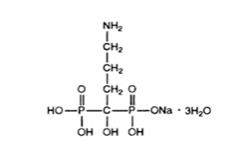
Structural Formula For Alendronate Sodium (Image 3)

Structural Formula For Alendronate Sodium (Image 3)
Chemical structure diagram of alendronate sodium showing its molecular connections, including amine, carbon chains, and phosphonate groups with sodium and water molecules.*
FDA Label Image

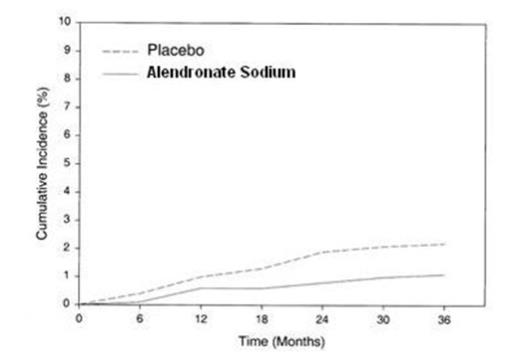
Cumulative Incidence Of Hip Fractures In The Three-year Study Of Fit (patients With Radiographic Vertebral Fracture At Baseline) (Image 4)

Cumulative Incidence Of Hip Fractures In The Three-year Study Of Fit (patients With Radiographic Vertebral Fracture At Baseline) (Image 4)
A line graph comparing cumulative incidence over time (months) between Alendronate Sodium and placebo groups. The y-axis represents cumulative incidence percentage from 0 to 10%, and the x-axis shows time in months from 0 to 36. The Alendronate Sodium group shows a lower incidence over time compared to the placebo group.*
FDA Label Image

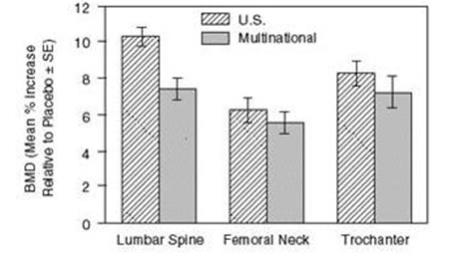
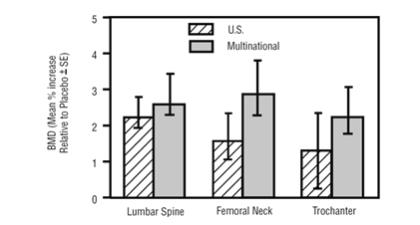
Osteoporosis Treatment Studies In Postmenopausal Women Increase In Bmd Alendronate Sodium 10 mg/day At Three Years (Image 5)

Osteoporosis Treatment Studies In Postmenopausal Women Increase In Bmd Alendronate Sodium 10 mg/day At Three Years (Image 5)
A bar chart comparing bone mineral density (BMD) mean percentage increases relative to placebo between U.S. and multinational groups. The chart shows three anatomical sites: Lumbar Spine, Femoral Neck, and Trochanter, with error bars indicating standard error (SE). U.S. group bars are hatched, and multinational group bars are solid gray.*
FDA Label Image

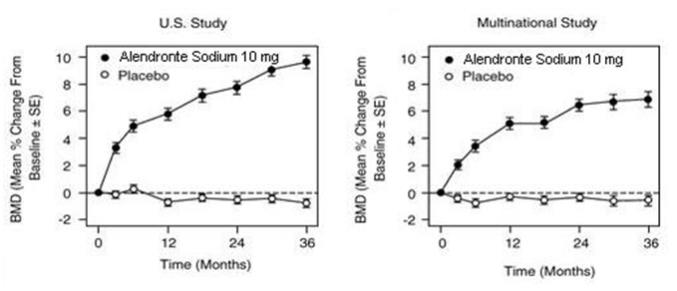
Osteoporosis Treatment Studies In Postmenopausal Women Time Course Of Effect Of Alendronate Sodium 10 mg/day Versus Placebo: Lumbar Spine Bmd Percent Change From Baseline (Image 6)

Osteoporosis Treatment Studies In Postmenopausal Women Time Course Of Effect Of Alendronate Sodium 10 mg/day Versus Placebo: Lumbar Spine Bmd Percent Change From Baseline (Image 6)
Two line graphs comparing the mean percentage change in bone mineral density (BMD) from baseline over time in months for alendronate sodium 10 mg versus placebo. The left graph represents a U.S. Study and the right graph a Multinational Study, both showing higher BMD increase over 36 months for alendronate sodium compared to placebo.*
FDA Label Image

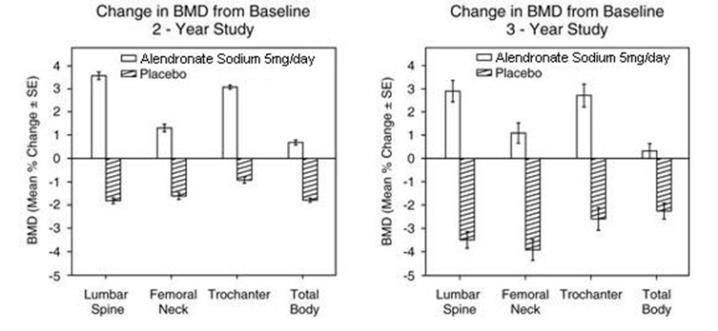
Osteoporosis Prevention Studies In Postmenopausal Women (Image 7)

Osteoporosis Prevention Studies In Postmenopausal Women (Image 7)
Two bar graphs comparing the change in bone mineral density (BMD) from baseline over 2 and 3 years for alendronate sodium 5 mg/day versus placebo. Both graphs show BMD percent change with standard error for lumbar spine, femoral neck, trochanter, and total body regions. Alendronate sodium shows positive BMD changes, while placebo shows negative changes in most regions.*
FDA Label Image

Studies In Glucocorticoid (Treated Patients Increase in BMD Alendronate Sodium 5 mg/day at One Year)

Studies In Glucocorticoid (Treated Patients Increase in BMD Alendronate Sodium 5 mg/day at One Year)
A bar graph comparing mean percent increase in bone mineral density (BMD) relative to placebo at the lumbar spine, femoral neck, and trochanter sites between U.S. and Multinational groups. Error bars indicate standard error around the mean values.*
FDA Label Image

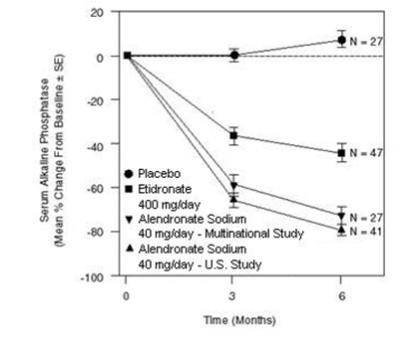
Studies In Paget’s Disease Of Bone Effect On Serum Alkaline Phosphatase Of Alendronate Sodium 40 mg/day Versus Placebo Or Etidronate 400 mg/day (Image 9)

Studies In Paget’s Disease Of Bone Effect On Serum Alkaline Phosphatase Of Alendronate Sodium 40 mg/day Versus Placebo Or Etidronate 400 mg/day (Image 9)
A line graph depicting the serum alkaline phosphatase mean percentage change from baseline over time (0, 3, and 6 months) for four groups: placebo, etidronate 400 mg/day, alendronate sodium 40 mg/day multinational study, and alendronate sodium 40 mg/day U.S. study. The graph shows a decrease in enzyme levels for alendronate groups, an increase for placebo, and a slight decrease for etidronate.*
FDA Label Image

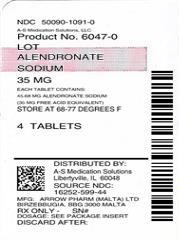
Label Image (Lbl500901091)

Label Image (Lbl500901091)
Label for alendronate sodium 35 mg tablets by A-S Medication Solutions. The label includes the product number (6047-0) and lot number (not specified), instructions to store at 68-77 degrees Fahrenheit, and states that the package contains 4 tablets. It also lists the distributor as A-S Medication Solutions in Libertyville, IL, with a barcode and additional manufacturer information.*
FDA Label Image

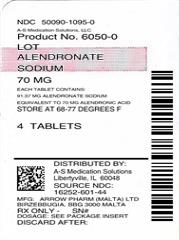
Label Image (Lbl500901095)

Label Image (Lbl500901095)
Label for alendronate sodium 70 mg tablets from A-S Medication Solutions. The label states the product number 6050-0 and lot number 300G. It contains 4 tablets, each equivalent to 70 mg of alendronate sodium. Storage instructions advise keeping the product at 68-77 degrees Fahrenheit. Distributor information is provided as A-S Medication Solutions in Libertyville, Illinois, with an address and phone number.*

* About these descriptions: Image descriptions on this page are generated by automated AI analysis of the product label images from the manufacturer's FDA label submission (SPL). They are provided for reference only and may contain errors or omissions. Always rely on the printed label itself and the official FDA labeling, and consult a pharmacist or healthcare professional with any questions about this product.