Label Image (Lbl500901300)
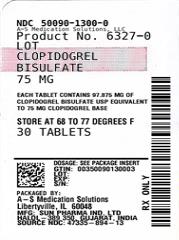
This is a product description for Clopidogrel Bisulfate tablets. The product has a product number of 6327-0 and contains 75mg of Clopidogrel Bisulfate. It is recommended to store the tablets at 87°F or under. The product comes with 30 tablets.*