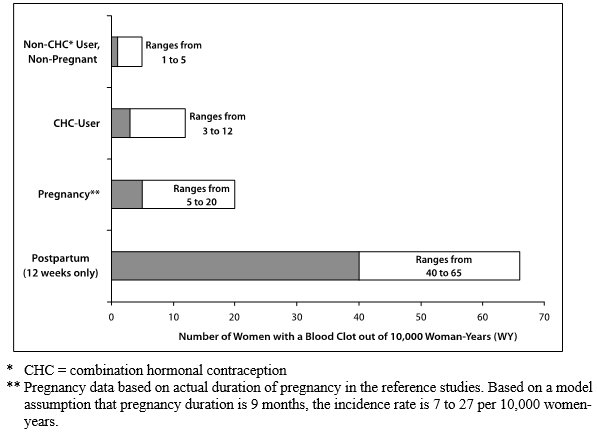
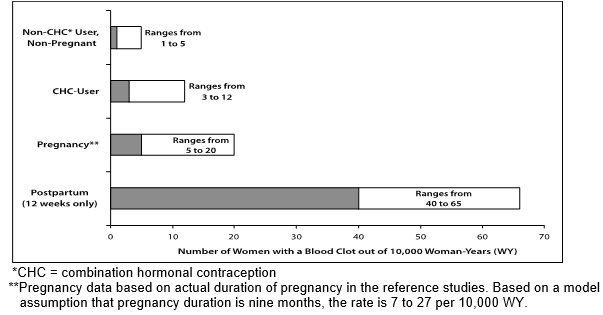
Figure 1: Vte Risk Of Norelgestromin And Ethinyl Estradiol Transdermal System Relative To Combined Oral Contraceptives (Image 01)

This text provides information on different methods of birth control, including implants, injections, intrauterine devices, birth control pills, skin patches, vaginal rings with hormones, condoms, diaphragms, spermicide, withdrawal, and abstaining from sex on fertile days of the monthly cycle. It also discusses the varying number of pregnancies per 100 women in one year based on the birth control method used.*
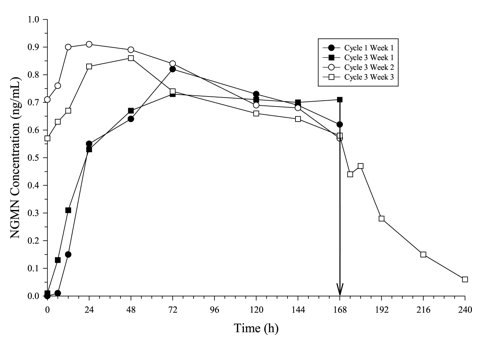
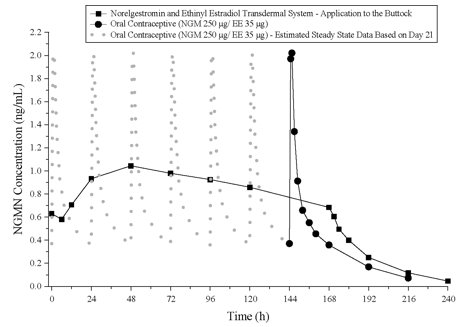
![Figure 5: Mean Serum Concentration-time Profiles Of Ngmn Following Once-daily Administration Of An Oral Contraceptive For Two Cycles Or Application Of Norelgestromin And Ethinyl Estradiol Transdermal System For Two Cycles To The Buttock In Healthy Female Volunteers. [oral Contraceptive: Cycle 2, Days 15 To 21, Norelgestromin And Ethinyl Estradiol Transdermal System: Cycle 2, Week 3] (Image 02)](https://ndclist.com/assets/spl/images/adcf17ef-e60b-48a4-9478-3998dab2bbbd/image-02.jpg)

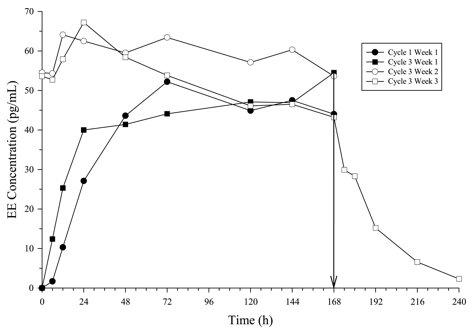
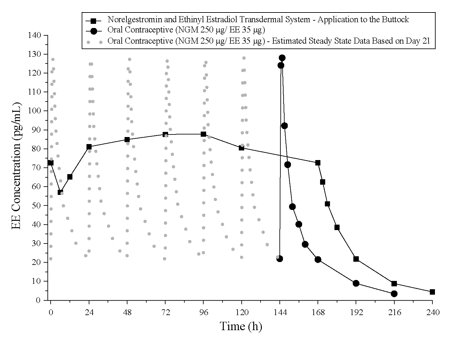
![Figure 6: Mean Serum Concentration-time Profiles Of Ee Following Once-daily Administration Of An Oral Contraceptive For Two Cycles Or Application Of Norelgestromin And Ethinyl Estradiol Transdermal System For Two Cycles To The Buttock In Healthy Female Volunteers. [oral Contraceptive: Cycle 2, Days 15 To 21, Norelgestromin And Ethinyl Estradiol Transdermal System: Cycle 2, Week 3] (Image 04)](https://ndclist.com/assets/spl/images/adcf17ef-e60b-48a4-9478-3998dab2bbbd/image-04.jpg)