Prezcobix Tablet, Film Coated
Product Images NDC 50090-1723

View Photos of Packaging, Regulatory Labels, and Product Appearance

Product Visual Gallery

This gallery contains 5 technical images submitted to the FDA as part of the official labeling for Prezcobix (NDC 50090-1723). Unlike standard consumer photos, these assets often include clinical data figures, molecular chemical structures, and official manufacturer packaging layouts.

As provided by A-s Medication Solutions, these visuals offer a comprehensive scientific overview of the product's physical and chemical identity, aiding pharmacists and researchers in product verification and study.

FDA Label Image

Label Image (Lbl500901723)

Label Image (Lbl500901723)
PREZCOBIX 800 mg/150 mg/1 mg/1 tablet, film coated oral tablets from A-S Medication Solutions. The label states each tablet contains 800 mg darunavir ethanolate and 150 mg cobicistat. The package includes 30 tablets and indicates storage at 68 to 77 degrees Fahrenheit. Distributed by A-S Medication Solutions, Libertyville, Illinois.*
FDA Label Image

Chemical Structure (Prezcobix 01)

Chemical Structure (Prezcobix 01)
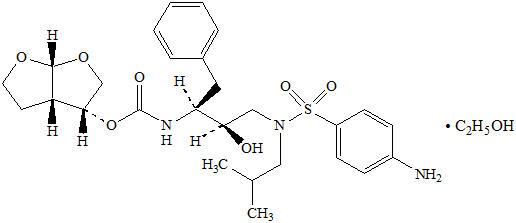
Chemical structure diagram of darunavir ethanolate, showing its molecular composition, including functional groups and atoms, accompanied by an ethanol molecule (C2H5OH).*
FDA Label Image

Chemical Structure (Prezcobix 02)

Chemical Structure (Prezcobix 02)
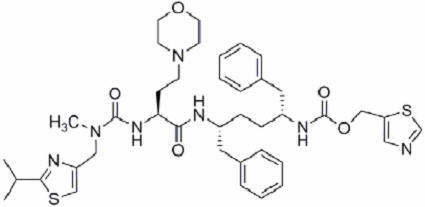
Chemical structure illustrating the molecular configuration of Darunavir Ethanolamine, the active ingredient in Prezcobix tablets. The diagram shows atoms and bonds characteristic of this protease inhibitor used in HIV treatment.*
FDA Label Image

Prezcobix 03

Prezcobix 03
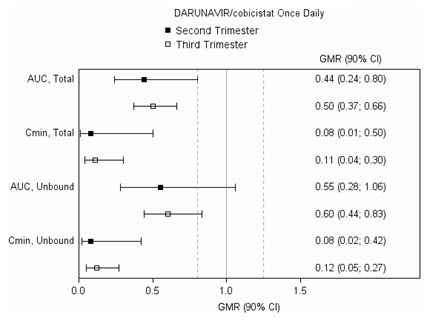
A forest plot illustrating pharmacokinetic parameters of darunavir/cobicistat administered once daily, comparing second and third trimester values. Parameters shown include total and unbound AUC and Cmin with geometric mean ratios and 90% confidence intervals.*
FDA Label Image

Prezcobix 03a

Prezcobix 03a
A horizontal error bar chart titled 'Cobicistat Once Daily' comparing pharmacokinetic parameters (AUC, Total and Cmin, Total) during the second and third trimesters. The graph displays geometric mean ratios (GMR) with 90% confidence intervals for two different trimesters, indicated by filled squares for the second trimester and open squares for the third trimester, plotted along an x-axis labeled with GMR (90% CI) values ranging approximately from 0 to 1.5.*

* About these descriptions: Image descriptions on this page are generated by automated AI analysis of the product label images from the manufacturer's FDA label submission (SPL). They are provided for reference only and may contain errors or omissions. Always rely on the printed label itself and the official FDA labeling, and consult a pharmacist or healthcare professional with any questions about this product.