Sildenafil Tablet
Product Images NDC 50090-1766

View Photos of Packaging, Regulatory Labels, and Product Appearance

Product Visual Gallery

This gallery contains 9 technical images submitted to the FDA as part of the official labeling for Sildenafil (NDC 50090-1766). Unlike standard consumer photos, these assets often include clinical data figures, molecular chemical structures, and official manufacturer packaging layouts.

As provided by A-s Medication Solutions, these visuals offer a comprehensive scientific overview of the product's physical and chemical identity, aiding pharmacists and researchers in product verification and study.

FDA Label Image

Label Image (Lbl500901766)
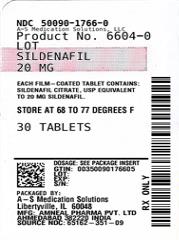
Label Image (Lbl500901766)
Sildenafil 20 mg oral tablets in a white bottle with black and red text, labeled by A-S Medication Solutions. The label indicates the NDC number 50090-1766-0, quantity of 30 tablets, storage instructions to keep between 68 to 77 degrees Fahrenheit, and that each coated tablet contains sildenafil citrate equivalent to 20 mg sildenafil.*
FDA Label Image

Sildenafil Tablets 20mg 1

Sildenafil Tablets 20mg 1
A step-line chart depicting the estimated cumulative mortality rate (%) over time in years for three dose groups labeled High Dose, Medium Dose, and Low Dose. The y-axis shows mortality rate percentages from 0 to 25%, and the x-axis represents time from 0 to 5 years. A risk table above the graph indicates the number of subjects at risk in each dose group at various time points.*
FDA Label Image

Sildenafil Tablets 20mg 2

Sildenafil Tablets 20mg 2
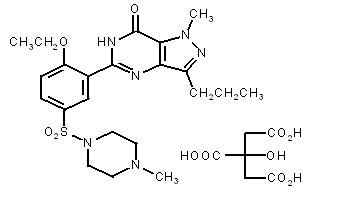
Chemical structure diagram of Sildenafil, depicting its molecular components and arrangement as commonly represented in pharmaceutical labeling.*
FDA Label Image

Sildenafil Tablets 20mg 3

Sildenafil Tablets 20mg 3
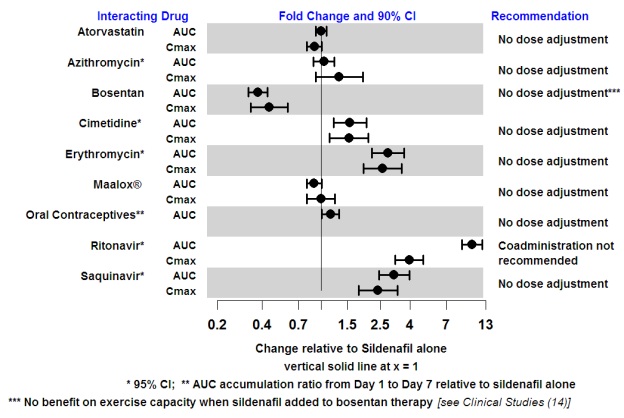
A chart depicting the fold change and 90% confidence interval in pharmacokinetic parameters AUC and Cmax of Sildenafil when coadministered with various interacting drugs. The x-axis shows the change relative to Sildenafil alone, with a vertical line at 1 indicating no change. Drug names and recommendations on dose adjustment are listed alongside the corresponding fold change data points with confidence intervals.*
FDA Label Image

Sildenafil Tablets 20mg 4

Sildenafil Tablets 20mg 4
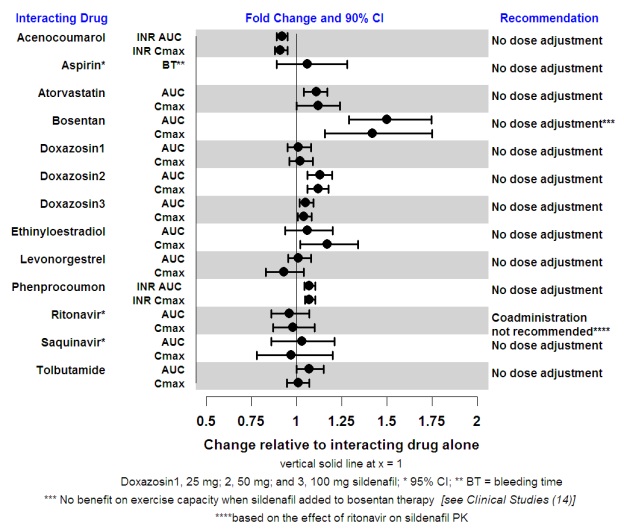
A forest plot chart showing fold change and 90% confidence intervals for various drugs interacting with sildenafil. The x-axis represents change relative to the interacting drug alone, centered at 1. The y-axis lists interacting drugs including Acenocoumarol, Aspirin, Atorvastatin, Bosentan, Doxazosin, Ethinyloestradiol, Levonorgestrel, Phenprocoumon, Ritonavir, Saquinavir, and Tolbutamide, with recommendations on dose adjustment ranging mostly to 'No dose adjustment' and a note that Ritonavir coadministration is not recommended.*
FDA Label Image

Sildenafil Tablets 20mg 5

Sildenafil Tablets 20mg 5
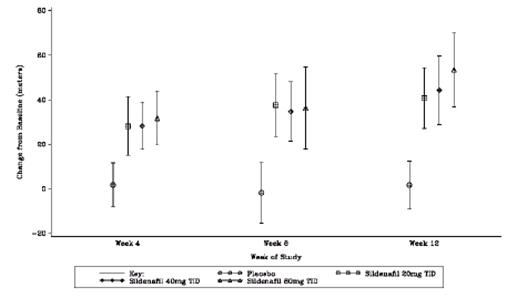
A line graph showing changes in a measured variable over Week 4, Week 8, and Week 12 for different Sildenafil dosages and placebo. The y-axis represents change from baseline in centimeters. Separate lines with markers represent Sildenafil 40 mg TID, Sildenafil 60 mg TID, Sildenafil 20 mg TID, and placebo. Error bars are included for each data point.*
FDA Label Image

Sildenafil Tablets 20mg 6

Sildenafil Tablets 20mg 6
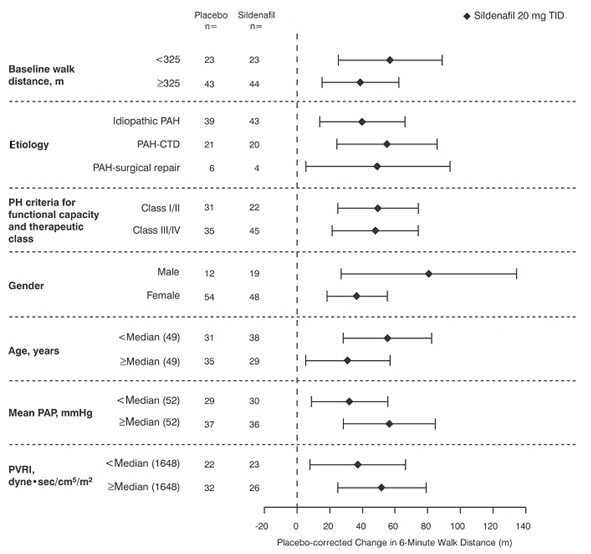
A forest plot chart showing the placebo-corrected change in 6-minute walk distance (in meters) for Sildenafil 20 mg taken three times daily compared to placebo. The chart breaks down results by baseline walk distance, etiology, pulmonary hypertension functional class, gender, age, mean pulmonary artery pressure (PAP), and pulmonary vascular resistance index (PVRI), with data points and 95% confidence intervals for each subgroup.*
FDA Label Image

Sildenafil Tablets 20mg 7

Sildenafil Tablets 20mg 7
A line graph comparing the percentage of patients without a clinically worsening event over time (up to 112 days) between Sildenafil and placebo groups. The x-axis represents days from randomization; the y-axis shows the percentage without clinically worsening events. Two lines are displayed, one for Sildenafil and one for placebo, with Sildenafil maintaining a higher percentage throughout the period.*
FDA Label Image

Sildenafil Tablets 20mg 8

Sildenafil Tablets 20mg 8
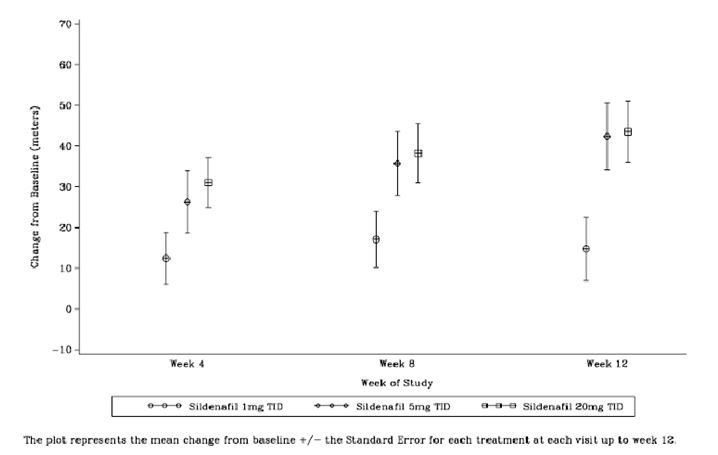
A line graph showing the mean change from baseline (in meters) with standard error bars for Sildenafil administered at 1 mg, 5 mg, and 20 mg three times daily (TID) over 12 weeks. The x-axis represents weeks of study (Weeks 4, 8, and 12), and the y-axis shows change from baseline in meters. The graph compares the efficacy of different Sildenafil dosages over time.*

* About these descriptions: Image descriptions on this page are generated by automated AI analysis of the product label images from the manufacturer's FDA label submission (SPL). They are provided for reference only and may contain errors or omissions. Always rely on the printed label itself and the official FDA labeling, and consult a pharmacist or healthcare professional with any questions about this product.