Irbesartanfigure3.jpg (Irbesartanfigure3)
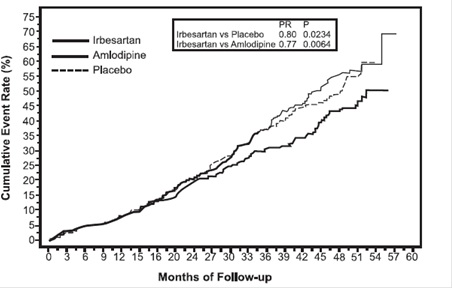
The text is a chart displaying the cumulative event rates for two groups within a study over a period of 60 months. The two groups are labeled "placebo" and "Ariadipne". The percentages represent the cumulative event rate for each group. It is not clear what the study was looking at or what type of events were being measured.*