Alendronate Sodium
Product Images NDC 50090-2322

View Photos of Packaging, Regulatory Labels, and Product Appearance

Product Visual Gallery

This gallery contains 8 technical images submitted to the FDA as part of the official labeling for Alendronate Sodium (NDC 50090-2322). Unlike standard consumer photos, these assets often include clinical data figures, molecular chemical structures, and official manufacturer packaging layouts.

As provided by A-s Medication Solutions, these visuals offer a comprehensive scientific overview of the product's physical and chemical identity, aiding pharmacists and researchers in product verification and study.

FDA Label Image

Figure 1 (Alendronate Fig1)

Figure 1 (Alendronate Fig1)
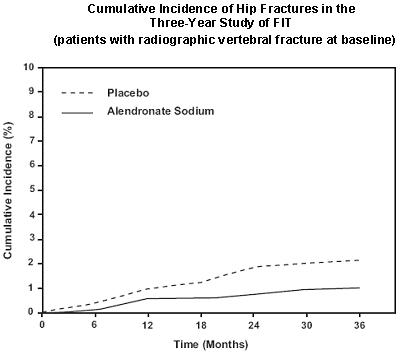
The text describes the cumulative incidence of hip fractures in a three-year study conducted on patients with radiographic vertebral fracture at baseline. The percentage of cumulative incidence is shown through a graph that compares the placebo group to the group administered with Alendronate Sodium. The time frame of the study is measured in months.*
FDA Label Image

Figure 2 (Alendronate Fig2)

Figure 2 (Alendronate Fig2)
This text provides information about the increase in bone mineral density (BMD) in postmenopausal women who were administered Alendronate 10 mg/day for three years to treat osteoporosis. The BMD readings at different regions of the body, such as lumbar spine, femoral neck, and trochanter, are provided along with the percentage increase in BMD relative to a placebo. However, it is not clear what the "V72 vss" signifies, and that part of the text may be incomplete or inaccurate.*
FDA Label Image

Figure 3 (Alendronate Fig3)

FDA Label Image

Figure 4 (Alendronate Fig4)

FDA Label Image

Figure 5 (Alendronate Fig5)

FDA Label Image

Figure 6 (Alendronate Fig6)

Figure 6 (Alendronate Fig6)
The text describes a study on the effects of Alendronate 40mg/day on serum alkaline phosphatase in patients with Paget's Disease of Bone, compared to placebo or Etidronate 400mg/day. The study involved two groups, one with 27 patients from a multinational study, and the other with 41 patients from a US study. The data is presented as mean % change from baseline over a period of 6 months.*
FDA Label Image

Chemical Structure (Alendronate Str)

FDA Label Image

Label Image (Lbl500902322)

* These product label images have been analyzed using experimental machine learning. Please verify findings with the primary label text.