Terazosin Capsule
Product Images NDC 50090-2371

View Photos of Packaging, Regulatory Labels, and Product Appearance

Product Visual Gallery

This gallery contains 7 technical images submitted to the FDA as part of the official labeling for Terazosin (NDC 50090-2371). Unlike standard consumer photos, these assets often include clinical data figures, molecular chemical structures, and official manufacturer packaging layouts.

As provided by A-s Medication Solutions, these visuals offer a comprehensive scientific overview of the product's physical and chemical identity, aiding pharmacists and researchers in product verification and study.

FDA Label Image

Label Image (Lbl500901559)

Label Image (Lbl500901559)
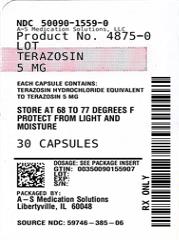
Product Name: Prazosin 5 MG Capsules Quantity: 30 Capsules Note: The has produced some gibberish text in the beginning which is not readable.*
FDA Label Image

Label Image (Lbl500902371)

FDA Label Image

Label Image (Lbl500902623)

FDA Label Image

Terazosin Hydrochloride Chemical Structure (Terazosin Hydrochloride Capsules 1)

FDA Label Image

Figure 1 (Terazosin Hydrochloride Capsules 2)

FDA Label Image

Figure 2 (Terazosin Hydrochloride Capsules 3)

Figure 2 (Terazosin Hydrochloride Capsules 3)
This appears to be a graph or table showing the mean change from baseline at different time points (in months) for a certain variable. However, without more context or information it is difficult to determine what the variable is or what type of study or research this is from.*
FDA Label Image

Figure 3 (Terazosin Hydrochloride Capsules 4)

Figure 3 (Terazosin Hydrochloride Capsules 4)
This appears to be a graph or table with a header indicating "Change from Baseline" and a unit of "mLsec". It displays measurements taken at different time intervals labeled "Month 0", "Month 1", "Month 2", etc. along with data points or values for each interval shown on the x-axis labeled "0", "3", "6", "9", "12", "15", "18", "21", "24", "27", and "30". Without additional context it is not clear what type of data is being measured or what the purpose of the graph/table is.*

* These product label images have been analyzed using experimental machine learning. Please verify findings with the primary label text.