Irbesartan Tablet
Product Images NDC 50090-2978

5 FDA label images from A-s Medication Solutions · Packaging, Regulatory Labels, and Product Appearance

Product Visual Gallery

This gallery contains 5 technical images submitted to the FDA as part of the official labeling for Irbesartan (NDC 50090-2978). Unlike standard consumer photos, these assets often include clinical data figures, molecular chemical structures, and official manufacturer packaging layouts.

As provided by A-s Medication Solutions, these visuals offer a comprehensive scientific overview of the product's physical and chemical identity, aiding pharmacists and researchers in product verification and study.

FDA Label Image

Label Image (Lbl500902978)

Label Image (Lbl500902978)
Packaging label for Irbesartan 300 mg oral tablets by A-S Medication Solutions. The label includes storage instructions to keep tablets between 68 to 77 degrees Fahrenheit and indicates a package quantity of 30 tablets. It also features the product NDC 50090-2978 and a dosage insert note for the dispenser.*
FDA Label Image

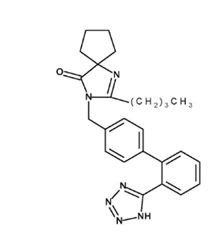
Structure (Spl Image1 Structure)

Structure (Spl Image1 Structure)
Chemical structure diagram of Irbesartan, showing its molecular composition and arrangement of atoms including rings and functional groups.*
FDA Label Image

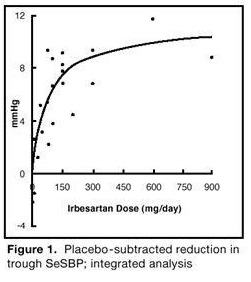
Figure 1 (Spl Image2 Figure1)

Figure 1 (Spl Image2 Figure1)
A scatter plot with a fitted curve showing the relationship between Irbesartan dose (mg/day) on the x-axis and placebo-subtracted reduction in trough SeSBP (mmHg) on the y-axis. The graph illustrates dose-dependent increases in blood pressure reduction up to about 900 mg/day.*
FDA Label Image

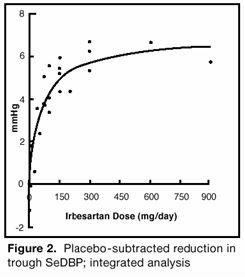
Figure 2 (Spl Image3 Figure2)

Figure 2 (Spl Image3 Figure2)
A scatter plot graph showing the placebo-subtracted reduction in trough SeDBP (systolic blood pressure) versus irbesartan dose in mg per day. Data points are scattered across doses up to 900 mg/day, with a curve fitted to the points illustrating an increasing response that plateaus.*
FDA Label Image

Figure 3 (Spl Image4 Figure3)

Figure 3 (Spl Image4 Figure3)
A cumulative event rate line chart comparing Irbesartan, Amlodipine, and Placebo over 57 months of follow-up. The x-axis shows months of follow-up, and the y-axis shows the cumulative event rate in percentage. The chart includes a legend for three groups and a small box displaying relative risk (RR) and p-values for Irbesartan versus Placebo and versus Amlodipine.*

* About these descriptions: Image descriptions on this page are generated by automated AI analysis of the product label images from the manufacturer's FDA label submission (SPL). They are provided for reference only and may contain errors or omissions. Always rely on the printed label itself and the official FDA labeling, and consult a pharmacist or healthcare professional with any questions about this product.