Gabapentin
Product Images NDC 50090-3318

View Photos of Packaging, Regulatory Labels, and Product Appearance

Product Visual Gallery

This gallery contains 10 technical images submitted to the FDA as part of the official labeling for Gabapentin (NDC 50090-3318). Unlike standard consumer photos, these assets often include clinical data figures, molecular chemical structures, and official manufacturer packaging layouts.

As provided by A-s Medication Solutions, these visuals offer a comprehensive scientific overview of the product's physical and chemical identity, aiding pharmacists and researchers in product verification and study.

FDA Label Image

1 (Image 1)

1 (Image 1)
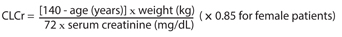
This text appears to be a formula used to estimate the glomerular filtration rate (GFR) in patients, which is a measure of the kidney function. The formula uses the patient's age and weight to calculate a value for cLcr, which is then multiplied by the serum creatinine level to estimate GFR. It is important to note that this is not a precise measure of kidney function and should only be used as a rough estimate.*
FDA Label Image

1 (Image 2)

FDA Label Image

1 (Image 3)

FDA Label Image

1 (Image 4)

FDA Label Image

1 (Image 5)

FDA Label Image

1 (Image 6)

1 (Image 6)
The text is describing a graph or table with a Mean Pain Score of 10. The graph or table shows a Dose Tiration Period that lasts for 4 weeks, followed by a 4-Week Fixed Dose Period. The options for treatment are Placebo and Gabapentin, with a daily dosage of 3600 mg. The Baseline is mentioned, but no further information is provided.*
FDA Label Image

2 (Image 7)

2 (Image 7)
This appears to be a chart showing the mean pain score across different treatment periods and doses of gabapentin. The chart shows a baseline pain score of 0 and compares the pain scores during a 3-week titration period to those during a 4-week fixed dose period. Two different doses of gabapentin (1800 mg/day and 2400 mg/day) are also compared. There is no further information provided.*
FDA Label Image

3 (Image 8)

FDA Label Image

4 (Image 9)

FDA Label Image

Label Image (Lbl500903318)

* These product label images have been analyzed using experimental machine learning. Please verify findings with the primary label text.