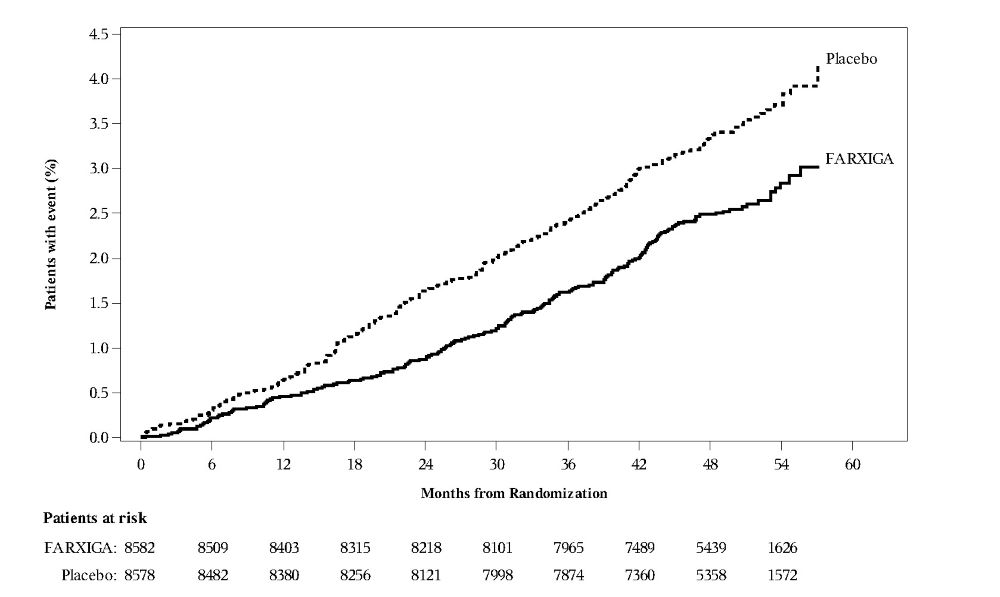
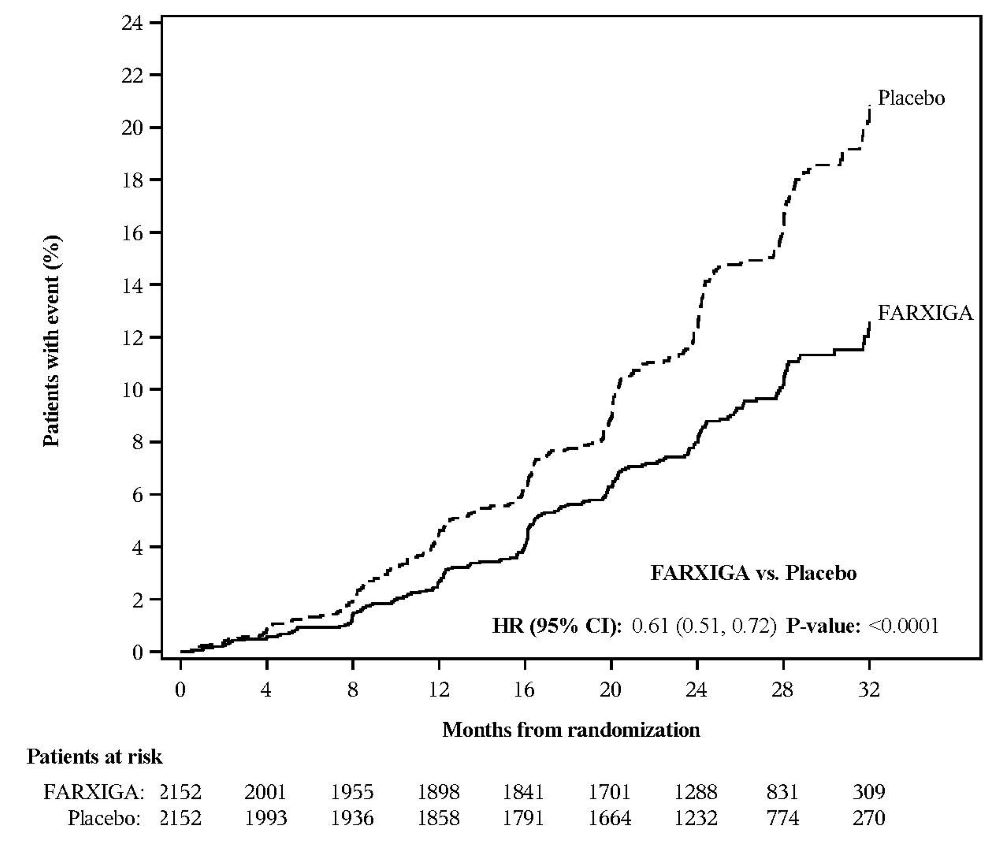
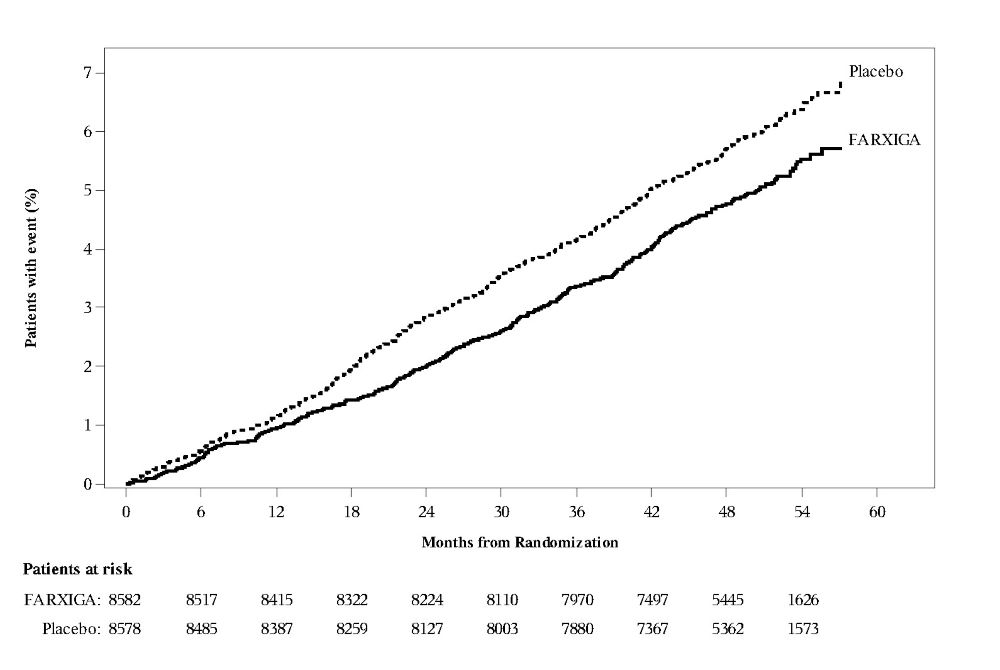
Farxiga Tablet, Film Coated
Product Images NDC 50090-3482
View Photos of Packaging, Regulatory Labels, and Product Appearance
Product Visual Gallery
This gallery contains 13 technical images submitted to the FDA as part of the official labeling for Farxiga (NDC 50090-3482). Unlike standard consumer photos, these assets often include clinical data figures, molecular chemical structures, and official manufacturer packaging layouts.
As provided by A-s Medication Solutions, these visuals offer a comprehensive scientific overview of the product's physical and chemical identity, aiding pharmacists and researchers in product verification and study.
Product Images & Figures Index
Figure 5 (Figure 5)
Figure 6a (Figure 6a)
Figure 6b (Figure 6b)
This is a clinical trial comparison between the drug FARXIGA and a placebo. The graph displays the percentage of patients with a medical event over a two-year period starting from randomization. Patients taking FARXIGA had a lower rate of medical events - the hazard ratio was 0.82 (with a 95% confidence interval of 0.69 to 0.98) and a P-value of 0.0294. The number of patients at risk over the 24 months is shown for both treatment groups.*
Figure 6c (Figure 6c)
Figure 7 (Figure 7)
Dapagliflozin Chemical Structure (Dapagliflozin Struct)
Figure 1 (Farxiga Fig1)
This appears to be a graph that shows the correlation between the dosage of a medication called Dapagiiizin and the amount of glucose present in the urine of study participants. There are two separate groups represented on the graph: healthy subjects and those with a condition abbreviated to "T20M". The graph includes two fitted lines to represent the correlation between dosage and glucose levels for these groups.*
Figure 8 (Figure 8)
Farxiga Figure 2 (Image 01)
Farxiga Figure 3 (Image 02)
This is a graph showing the adjusted mean change from baseline HbA1c levels over time in a study with randomized subjects who completed a short-term period without rescue. The graph includes two lines, one for the placebo plus metformin group and the other for the Farxiga 10 mg plus metformin group. The graph also includes error bars and study week intervals. The text also includes a description of the statistical models used to generate the data.*
Label Image (Lbl500903481)
Label Image (Lbl500903482)
* These product label images have been analyzed using experimental machine learning. Please verify findings with the primary label text.