Label Image (Lbl500903625)
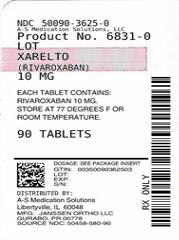
The text appears to be a product description for XARELTO, including a product number (6831-0), tablet quantity (90), and possibly a price ($3625.0). It is unclear what "LoF" and "{Eavgononn Ay" refer to.*