Dutasteride Capsule, Liquid Filled
Product Images NDC 50090-4010

11 FDA label images from A-s Medication Solutions · Packaging, Regulatory Labels, and Product Appearance

Product Visual Gallery

This gallery contains 11 technical images submitted to the FDA as part of the official labeling for Dutasteride (NDC 50090-4010). Unlike standard consumer photos, these assets often include clinical data figures, molecular chemical structures, and official manufacturer packaging layouts.

As provided by A-s Medication Solutions, these visuals offer a comprehensive scientific overview of the product's physical and chemical identity, aiding pharmacists and researchers in product verification and study.

FDA Label Image

Fig1 (Fig1)

Fig1 (Fig1)
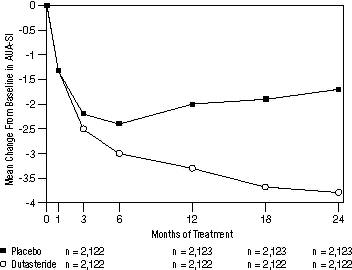
Line graph showing the mean change from baseline in AUASI scores over 24 months of treatment comparing Dutasteride to placebo, with data points at 0, 1, 3, 6, 12, 18, and 24 months. The graph illustrates a greater reduction in AUASI scores over time for Dutasteride compared to placebo, with patient numbers listed for each time point.*
FDA Label Image

Fig2 (Fig2)

Fig2 (Fig2)
A line graph comparing the cumulative retention of patients over 24 months of treatment between a placebo group and a dutasteride group. The x-axis represents months of treatment, and the y-axis shows retention of patients. The graph includes a table below listing the number of events and number of patients at risk at various time points for both groups.*
FDA Label Image

Fig3 (Fig3)

Fig3 (Fig3)
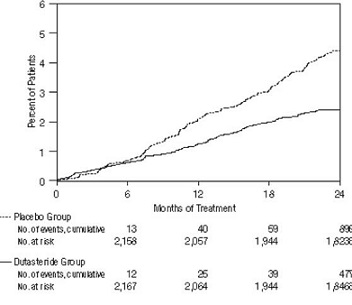
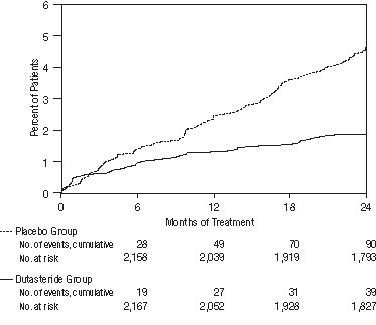
A line graph showing the cumulative percent of patients over 24 months of treatment, comparing the placebo group and the dutasteride group. The x-axis represents months of treatment from 0 to 24, and the y-axis shows the percent of patients up to 5%. Data tables below the graph show the number of cumulative events and patients at risk for each group over time.*
FDA Label Image

Fig4 (Fig4)

Fig4 (Fig4)
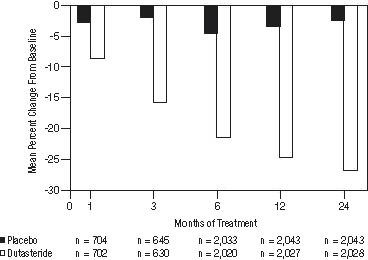
A bar chart displaying mean percent change from baseline over months of treatment, comparing placebo and Dutasteride groups. The x-axis shows treatment duration in months (0, 1, 3, 6, 12, 24), while the y-axis represents the mean percent change from baseline, with values decreasing below zero. Data counts for each group at each time point are indicated below the x-axis.*
FDA Label Image

Fig5 (Fig5)

Fig5 (Fig5)
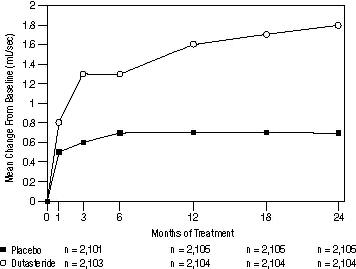
A line graph depicting mean change from baseline (ml/sec) over months of treatment (0 to 24) comparing Dutasteride and placebo. The graph shows data points at multiple intervals with Dutasteride exhibiting a higher mean increase over time relative to placebo. Sample sizes (n) are indicated below each time point for both groups.*
FDA Label Image

Fig6 (Fig6)

Fig6 (Fig6)
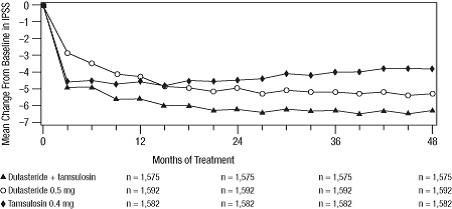
Line graph depicting the mean change from baseline in an unspecified measure over 48 months of treatment with Dutasteride plus tamsulosin, Dutasteride 0.5 mg, and Tamsulosin 0.4 mg. The x-axis represents months of treatment, and the y-axis shows the mean change from baseline. The graph includes data points and sample sizes for each treatment group over time.*
FDA Label Image

Fig7 (Fig7)

Fig7 (Fig7)
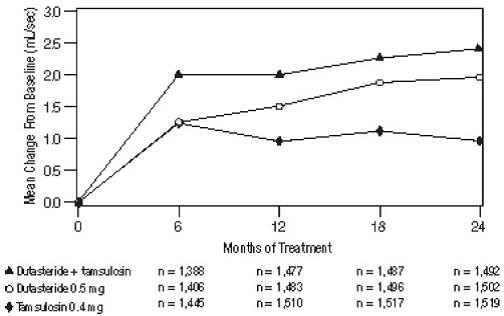
A line graph depicting mean change from baseline in decline over 24 months of treatment, comparing Dutasteride plus tamsulosin, Dutasteride 0.5 mg, and Tamsulosin 0.4 mg. The x-axis shows months of treatment (0, 6, 12, 18, 24) and the y-axis shows mean change from baseline (ml/sec). Sample sizes for each group at each time point are listed below the x-axis.*
FDA Label Image

Label Image (Lbl500904010)

Label Image (Lbl500904010)
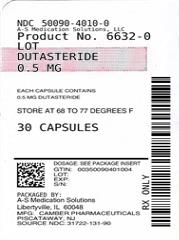
Dutasteride 0.5 mg capsule label from A-S Medication Solutions. The label includes the NDC 50090-4010-0, product number 6632-0, storage instructions to keep at 68 to 77 degrees Fahrenheit, and a package count of 30 liquid-filled capsules. It also features a QR code and additional packaging information.*
FDA Label Image

Structure (Structure)

Structure (Structure)
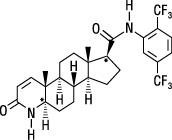
Chemical structure of Dutasteride, showing its complex steroidal backbone with attached trifluoromethyl-substituted aromatic ring and various hydrogen, oxygen, and nitrogen atoms represented.*
FDA Label Image

Tab1 (Tab1)

Tab1 (Tab1)
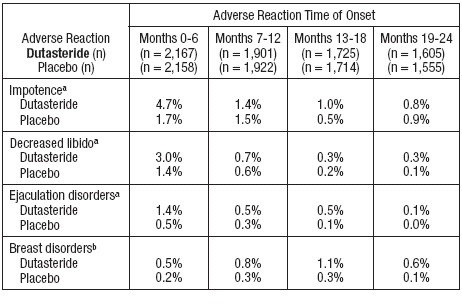
A data table presenting the time of onset for adverse reactions related to Dutasteride versus placebo. It compares percentages of impotence, decreased libido, ejaculation disorders, and breast disorders across four time periods: months 0-6, 7-12, 13-18, and 19-24.*
FDA Label Image

Tab2 (Tab2)

Tab2 (Tab2)
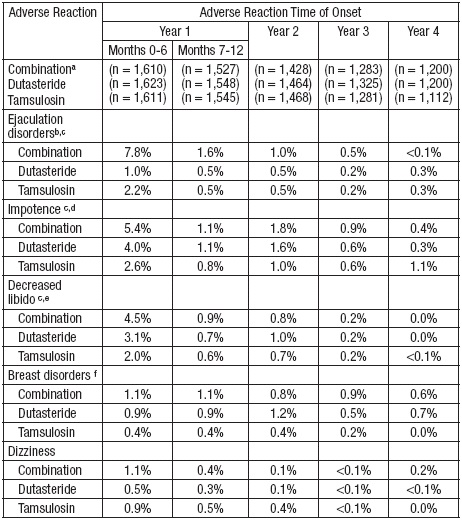
A table presenting adverse reaction rates over different years and time periods for Dutasteride, Tamsulosin, and their combination. Categories include ejaculation disorders, impotence, decreased libido, breast disorders, and dizziness with corresponding percentage incidences distributed from months 0-6 through year 4.*

* About these descriptions: Image descriptions on this page are generated by automated AI analysis of the product label images from the manufacturer's FDA label submission (SPL). They are provided for reference only and may contain errors or omissions. Always rely on the printed label itself and the official FDA labeling, and consult a pharmacist or healthcare professional with any questions about this product.