Product Images Levetiracetam
View Photos of Packaging, Labels & Appearance
Product Label Images
The following 8 images provide visual information about the product associated with Levetiracetam NDC 50090-4023 by A-s Medication Solutions, such as packaging, labeling, and the appearance of the drug itself. This resource could be helpful for medical professionals, pharmacists, and patients seeking to verify medication information and ensure they have the correct product.
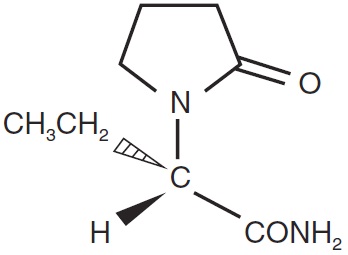
Levetiracetam is a medication available in a tablet form. Each tablet contains 1 gram of the active ingredient. This particular package contains 50 tablets with a total of 1600 milligrams.*
The figure shows responder rates in Study 1, with a 250% reduction from baseline. The percentage values range from 0% to 39.6%, and there is a statistical significance when compared with the placebo. The rest of the text contains non-English characters and cannot be used to form a description.*
The text describes a figure, specifically Figure 2, which shows the Responder Rate in Study 2 during a certain period called Period A. The figure displays the percentage of patients who showed a reduction of 250% from the baseline. The percentage of patients who responded is given for three treatment groups: Placebo (N=111), Levetiracetam 1000 mg/day (N=106), and Levetiracetam 2000 mg/day (N=105). One of the percentages is statistically significant versus placebo.*
The figure shows the responder rate (50% reduction from baseline) in Study 4. The placebo group (N=97) had a responder rate of 19.6%, while the levetiracetam group (N=101) had a significantly higher responder rate of 44.6%. The value for the responder rate in the levetiracetam group is 45%, and there is a statistically significant difference between the levetiracetam and placebo groups.*
The figure shows the responder rate of patients aged 1 month to <4 years in Study 5, indicating >50% reduction from baseline. The graph compares the results of patients administered with Levetiracetam and Placebo. The percentage of patients who responded to the treatment is plotted on the Y-axis, while the type of treatment (Levetiracetam or Placebo) is plotted on the X-axis. The results show that Levetiracetam was statistically significant in reducing the rate of responders compared to Placebo.*
The text describes a graph or figure showing the Responder Rate in percentage for patients suffering from PGTC Seizure Frequency per Week. The Responder Rate has been reduced by 250% from Baseline. The study included a Placebo group with 84 patients and a Levetiracetam group with 79 patients. The graph shows that the Levetiracetam group had a statistically significant better response rate as compared to the Placebo group.*
* The product label images have been analyzed using a combination of traditional computing and machine learning techniques. It should be noted that the descriptions provided may not be entirely accurate as they are experimental in nature. Use the information in this page at your own discretion and risk.