Alendronate Sodium
Product Images NDC 50090-4076

View Photos of Packaging, Regulatory Labels, and Product Appearance

Product Visual Gallery

This gallery contains 8 technical images submitted to the FDA as part of the official labeling for Alendronate Sodium (NDC 50090-4076). Unlike standard consumer photos, these assets often include clinical data figures, molecular chemical structures, and official manufacturer packaging layouts.

As provided by A-s Medication Solutions, these visuals offer a comprehensive scientific overview of the product's physical and chemical identity, aiding pharmacists and researchers in product verification and study.

FDA Label Image

1203dd0c 809a 4409 B948 B5e816b8a63a 01
1203dd0c 809a 4409 B948 B5e816b8a63a 01
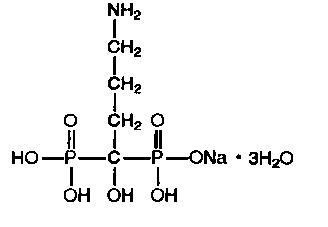
Chemical structure diagram of Alendronate Sodium. The structure shows its bisphosphonate backbone with a central carbon atom bonded to two phosphonate groups, an amino group, and hydrated with three water molecules.*
FDA Label Image

1203dd0c 809a 4409 B948 B5e816b8a63a 02

1203dd0c 809a 4409 B948 B5e816b8a63a 02
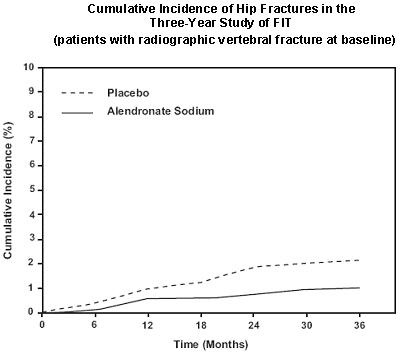
A line graph showing the cumulative incidence of hip fractures over 36 months in patients with radiographic vertebral fracture at baseline from a three-year study of FIT. The graph compares placebo and alendronate sodium, with cumulative incidence percentages on the y-axis and time in months on the x-axis, indicating lower incidence in the alendronate sodium group.*
FDA Label Image

1203dd0c 809a 4409 B948 B5e816b8a63a 03

1203dd0c 809a 4409 B948 B5e816b8a63a 03
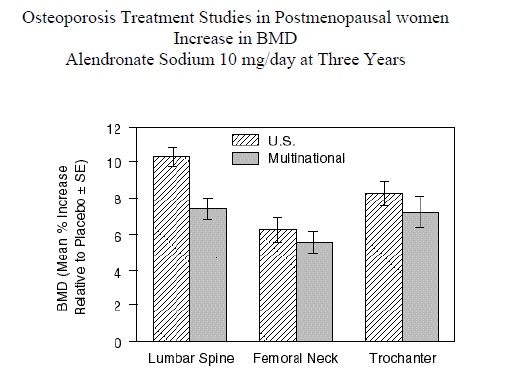
A bar chart titled 'Osteoporosis Treatment Studies in Postmenopausal Women' showing the increase in bone mineral density (BMD) at three years for Alendronate Sodium 10 mg/day. It compares mean percentage BMD increase relative to placebo between U.S. and multinational populations at three anatomical sites: lumbar spine, femoral neck, and trochanter.*
FDA Label Image

1203dd0c 809a 4409 B948 B5e816b8a63a 04

1203dd0c 809a 4409 B948 B5e816b8a63a 04
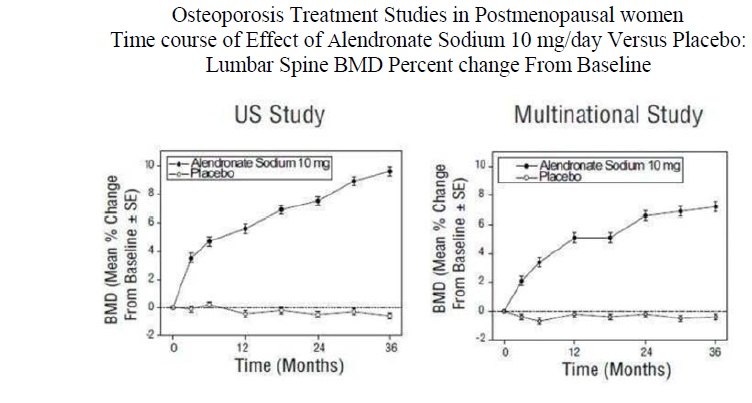
A figure displaying two line graphs comparing the time course effect of Alendronate Sodium 10 mg/day versus placebo on lumbar spine bone mineral density (BMD) percent change from baseline in postmenopausal women. The left graph represents a US study, and the right graph represents a multinational study, both showing BMD percent change on the y-axis and time in months on the x-axis.*
FDA Label Image

1203dd0c 809a 4409 B948 B5e816b8a63a 05

1203dd0c 809a 4409 B948 B5e816b8a63a 05
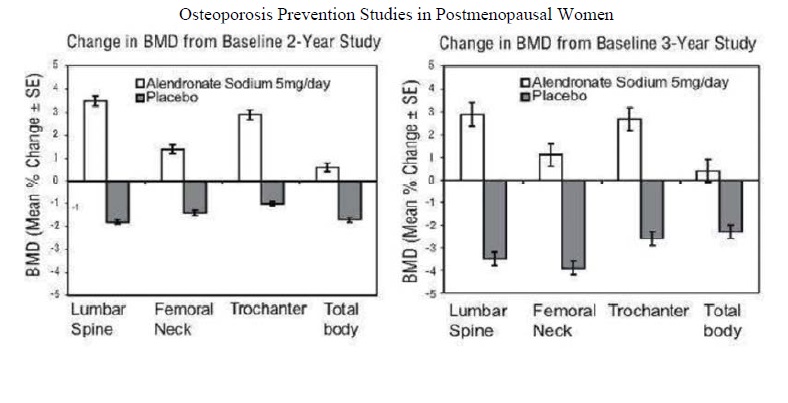
Two bar graphs illustrating changes in bone mineral density (BMD) from baseline in postmenopausal women during osteoporosis prevention studies. The left graph shows BMD changes over a 2-year period, and the right shows changes over a 3-year period, comparing Alendronate Sodium 5 mg/day with placebo at lumbar spine, femoral neck, trochanter, and total body sites.*
FDA Label Image

1203dd0c 809a 4409 B948 B5e816b8a63a 06

1203dd0c 809a 4409 B948 B5e816b8a63a 06
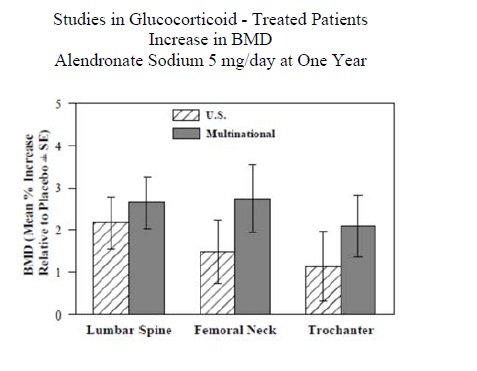
A bar chart titled 'Studies in Glucocorticoid-Treated Patients Increase in BMD Alendronate Sodium 5 mg/day at One Year' comparing mean percent increase in bone mineral density (BMD) at three anatomical sites: Lumbar Spine, Femoral Neck, and Trochanter. The chart compares results between U.S. and multinational study groups, with error bars depicting standard error.*
FDA Label Image

1203dd0c 809a 4409 B948 B5e816b8a63a 07

1203dd0c 809a 4409 B948 B5e816b8a63a 07
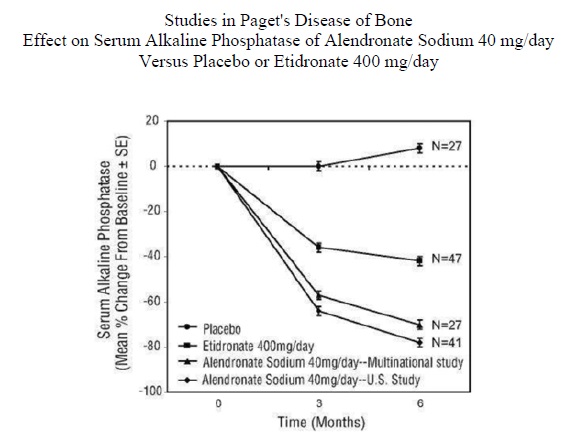
This line graph depicts the effect on serum alkaline phosphatase levels over 6 months in Paget's disease of bone, comparing Alendronate Sodium 40 mg/day (both multinational and U.S. studies), Etidronate 400 mg/day, and placebo. The y-axis shows mean percent change from baseline, with time in months on the x-axis, and sample sizes noted for each group.*
FDA Label Image

Label Image (Lbl500904076)

Label Image (Lbl500904076)
Label for ALENDRONATE SODIUM 35 MG tablets, labeled for once weekly use, from A-S Medication Solutions. The label indicates each tablet contains 35 mg of alendronate sodium, with a package of 1 blister containing 4 tablets. Storage instructions specify keeping between 68 to 77 degrees Fahrenheit.*

* About these descriptions: Image descriptions on this page are generated by automated AI analysis of the product label images from the manufacturer's FDA label submission (SPL). They are provided for reference only and may contain errors or omissions. Always rely on the printed label itself and the official FDA labeling, and consult a pharmacist or healthcare professional with any questions about this product.