Fluticasone Propionate And Salmeterol Powder
Product Images NDC 50090-4213

View Photos of Packaging, Regulatory Labels, and Product Appearance

Product Visual Gallery

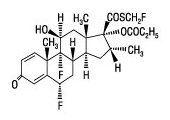
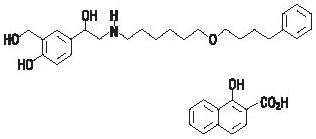
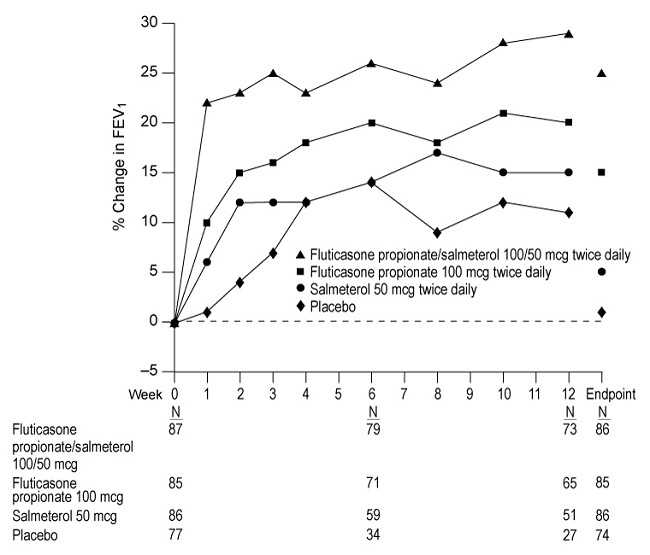
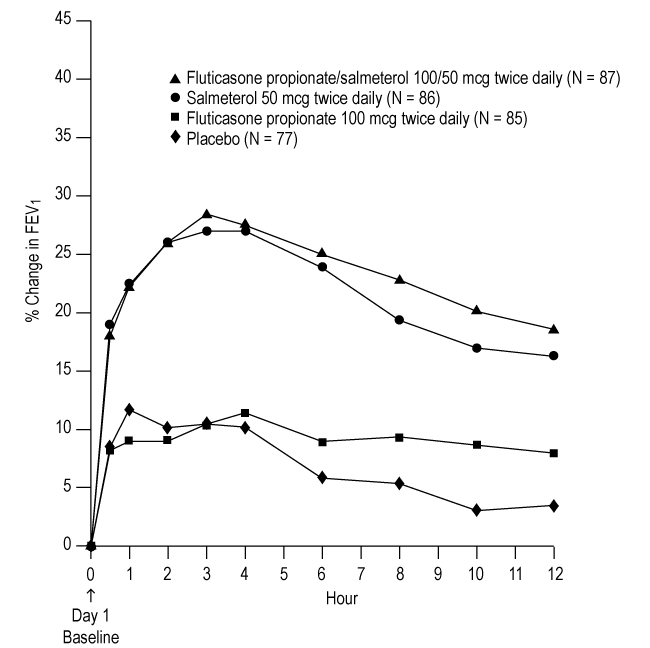
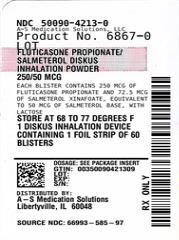
This gallery contains 16 technical images submitted to the FDA as part of the official labeling for Fluticasone Propionate And Salmeterol (NDC 50090-4213). Unlike standard consumer photos, these assets often include clinical data figures, molecular chemical structures, and official manufacturer packaging layouts.

As provided by A-s Medication Solutions, these visuals offer a comprehensive scientific overview of the product's physical and chemical identity, aiding pharmacists and researchers in product verification and study.

FDA Label Image

Fluticasone Propionate Chemical Structure (Fp Sal Spl Graphic 01)

FDA Label Image

Salmeterol Xinafoate Chemical Structure (Fp Sal Spl Graphic 02)

FDA Label Image

Figure 1. Mean Percent Change From Baseline In Fev1 In Subjects With Asthma Previously Treated With Either Inhaled Corticosteroids Or Salmeterol (trial 1) (Fp Sal Spl Graphic 03)

Figure 1. Mean Percent Change From Baseline In Fev1 In Subjects With Asthma Previously Treated With Either Inhaled Corticosteroids Or Salmeterol (trial 1) (Fp Sal Spl Graphic 03)
This appears to be a chart or graph of some sort, displaying the change in FEV (forced expiratory volume) over time with three different treatments: Fluticasone propionatelsalmeterol 100/50 meg twice daily, Fluticasone propionate 100 mog twice daily with Saimeterol 50 mog twice dally, and Placebo. The data for the different treatments is displayed on the chart, with the week number and corresponding FEV change recorded. Without more context, it is difficult to determine the purpose or significance of this data.*
FDA Label Image

Figure 2. Percent Change In Serial 12-hour Fev1 In Subjects With Asthma Previously Using Either Inhaled Corticosteroids Or Salmeterol (trial 1) (Fp Sal Spl Graphic 04)

Figure 2. Percent Change In Serial 12-hour Fev1 In Subjects With Asthma Previously Using Either Inhaled Corticosteroids Or Salmeterol (trial 1) (Fp Sal Spl Graphic 04)
This is a graph that shows the change in FEV4 over time for four different treatments. The treatments are Fluticasone propionate/salmeterol 100/50 mog twice daily, Salmeterol 50 meg twice daily, Fluticasone propionate 100 meg twice daily, and a Placebo. The graph shows a 9% increase in FEV4 after treatment for the Fluticasone propionate/salmeterol 100/50 mog twice daily group compared to the baseline on day 1. The other groups show little to no change in FEV4.*
FDA Label Image

Figure 3. Percent Change In Serial 12-hour Fev1 In Subjects With Asthma Previously Using Either Inhaled Corticosteroids Or Salmeterol (trial 1) (Fp Sal Spl Graphic 05)

Figure 3. Percent Change In Serial 12-hour Fev1 In Subjects With Asthma Previously Using Either Inhaled Corticosteroids Or Salmeterol (trial 1) (Fp Sal Spl Graphic 05)
This appears to be a chart showing the % change in FEV relative to day 1 baseline for four different treatment groups (A Fluticasone propionate/salmeterol 100/50 mcg twice daily, Salmeterol 50 mcg twice daily, Fluticasone propionate 100 mcg twice daily, and Placebo). The data is broken down by hour and week over a 12 week period. The baseline is also shown.*
FDA Label Image

Figure 4. Predose Fev1: Mean Percent Change From Baseline In Subjects With Chronic Obstructive Pulmonary Disease (Fp Sal Spl Graphic 06)

Figure 4. Predose Fev1: Mean Percent Change From Baseline In Subjects With Chronic Obstructive Pulmonary Disease (Fp Sal Spl Graphic 06)
This is a comparison of the effectiveness of Fluticasone propionate/salmeterol (250/50 mg) twice a day, salmeterol 50 mg twice a day, and placebo on patients with a baseline FEV (forced expiratory volume) between 1207 and 1232 mL. The graph shows the improvement on FEV over time for each treatment until the endpoint.*
FDA Label Image

Figure 5. Two-hour Postdose Fev1: Mean Percent Changes From Baseline Over Time In Subjects With Chronic Obstructive Pulmonary Disease (Fp Sal Spl Graphic 07)

Figure 5. Two-hour Postdose Fev1: Mean Percent Changes From Baseline Over Time In Subjects With Chronic Obstructive Pulmonary Disease (Fp Sal Spl Graphic 07)
This is a clinical trial data of three groups: Fluticasone propionate/salmeterol combination inhaler, Fluticasone propionate inhaler and Placebo inhaler. The trial checked the baseline FEV of each group, then administered the inhalers twice a day, and measured the FEV at different points in time up to Day 24. The table shows the results of the study for endpoints at different points in time.*
FDA Label Image

Figure A (Fp Sal Spl Graphic 08)

FDA Label Image

Figure B (Fp Sal Spl Graphic 09)

FDA Label Image

Figure C (Fp Sal Spl Graphic 10)

FDA Label Image

Ifu Figure D (Fp Sal Spl Graphic 11)

FDA Label Image

Figure E (Fp Sal Spl Graphic 12)

FDA Label Image

Figure F (Fp Sal Spl Graphic 13)

FDA Label Image

Ifu Figure G (Fp Sal Spl Graphic 14)

FDA Label Image

Figure H (Fp Sal Spl Graphic 15)

FDA Label Image

Label Image (Lbl500904213)

* These product label images have been analyzed using experimental machine learning. Please verify findings with the primary label text.