Figure1
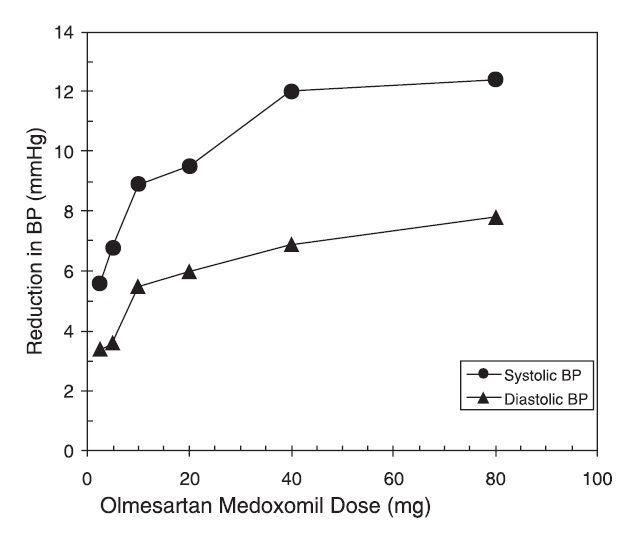
The text describes a graph showing the reduction in blood pressure (in millimeters of mercury) with increasing doses of Olmesartan Medoxomil, an antihypertensive medication. The graph shows a decrease in both systolic and diastolic blood pressure as the dose of the medication increases. The x and y-axes are labeled in increments of 20, up to a maximum dose of 100mg, and the reduction in blood pressure is measured in millimeters of mercury (mmHg).*