Product Images Sildenafil
View Photos of Packaging, Labels & Appearance
Product Label Images
The following 10 images provide visual information about the product associated with Sildenafil NDC 50090-4646 by A-s Medication Solutions, such as packaging, labeling, and the appearance of the drug itself. This resource could be helpful for medical professionals, pharmacists, and patients seeking to verify medication information and ensure they have the correct product.
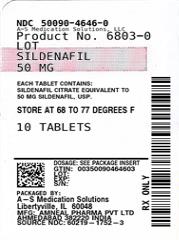
This is a product label for a medication called "Lof'Stldenafil 50mg". The product comes in a package of 16 tablets with a storage recommendation to keep it at a temperature of 8-70 degrees Celsius. Product number is also mentioned which is 6803-0.*
This is a blood pressure chart that compares the effects of Sildenafil 100mg to a placebo over a 24-hour period. However, without more context, it is difficult to provide more information.*
This is a chart that shows the change in SBP (Systolic Blood Pressure) in mmHg with time post dose in hours. There are two lines on the chart, one for doxazosin + placebo and one for doxazosin + sildenafil 25 mg. The change in SBP ranges from 20 mmHg to -40 mmHg.*
This is a graph showing the change in SBP (systolic blood pressure) in mmHg over time post-dose (in hours). There are two lines on the graph, one labeled "Doxazosin + Placebo" and the other labeled "Doxazosin + Sildenafil 50mg". The graph displays values from 0 to 8 hours and shows a decrease in SBP for both treatments. However, the line for "Doxazosin + Sildenafil 50mg" shows a greater decrease in SBP compared to "Doxazosin + Placebo".*
This appears to be a chart or graph displaying blood pressure measurements in mmHg over time after taking either Doxazosin and Sildenafil 100mg or Doxazosin and Placebo. There is not enough information to provide a more detailed description or analysis.*
This text contains numerical values and medication names, which suggests that it might be a table or graph showing the effectiveness of different doses of Sildenafil as a treatment. However, the table or graph is not readable due to missing labels and formatting. Therefore, it is not available.*
* The product label images have been analyzed using a combination of traditional computing and machine learning techniques. It should be noted that the descriptions provided may not be entirely accurate as they are experimental in nature. Use the information in this page at your own discretion and risk.