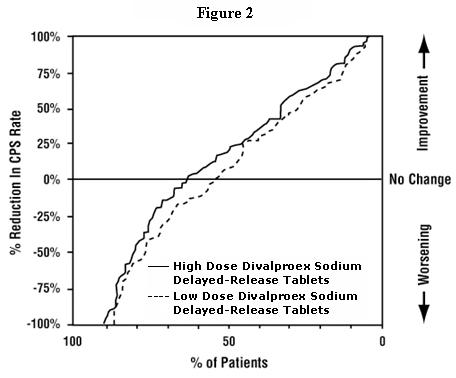
Figure 1 (Divalproex Fig1)
The text describes a graph or chart, labeled Figure 1, which shows the percentage reduction in CPS rate for patients given Divalproex Sodium Delayed-Release Tablets as compared to patients given a placebo. The graph shows that half of the patients showed improvement while the other half showed either no change or worsening.*