Gabapentin
Product Images NDC 50090-4889

View Photos of Packaging, Regulatory Labels, and Product Appearance

Product Visual Gallery

This gallery contains 7 technical images submitted to the FDA as part of the official labeling for Gabapentin (NDC 50090-4889). Unlike standard consumer photos, these assets often include clinical data figures, molecular chemical structures, and official manufacturer packaging layouts.

As provided by A-s Medication Solutions, these visuals offer a comprehensive scientific overview of the product's physical and chemical identity, aiding pharmacists and researchers in product verification and study.

FDA Label Image

Formula (Ab1e0185 B802 4cf2 A5d4 B71f27f1dcb0 00)

Formula (Ab1e0185 B802 4cf2 A5d4 B71f27f1dcb0 00)
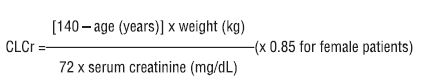
This is a formula for estimating creatinine clearance (ClCr) in patients, which measures how well the kidneys are filtering waste from the blood. The formula takes into account the patient's age and weight, as well as their serum creatinine level. For female patients, the result of the formula is multiplied by 0.85.*
FDA Label Image

Figure1 (D45f499b 8612 479e 8dd2 4fe28b1f5f9c 01)

FDA Label Image

Image 1 (D45f499b 8612 479e 8dd2 4fe28b1f5f9c 02)

FDA Label Image

Image 2 (D45f499b 8612 479e 8dd2 4fe28b1f5f9c 03)

Image 2 (D45f499b 8612 479e 8dd2 4fe28b1f5f9c 03)
This is a data table showing a fixed dose period of four weeks for a study on Gabapentin. Two doses of Gabapentin (1800 mg/day and 2400 mg/day) were compared to a placebo. The mean pain score was measured at baseline and throughout the trial period (1-7). No further information is available.*
FDA Label Image

Image 3 (D45f499b 8612 479e 8dd2 4fe28b1f5f9c 04)

Image 3 (D45f499b 8612 479e 8dd2 4fe28b1f5f9c 04)
This is a chart showing the proportion of responders (patients with more than 50% reduction in pain score) in controlled studies for PHN. There are two studies represented in the graph, Study 1 and Study 2, with the percentage of responders indicated for each treatment group - GBP 3600, PBO, GBP 1800, and GBP 2400. There are also some statistics indicated, with significance levels denoted in p-values, but they are not fully readable due to errors.*
FDA Label Image

Image 4 (D45f499b 8612 479e 8dd2 4fe28b1f5f9c 05)

FDA Label Image

Label Image (Lbl500904889)

* These product label images have been analyzed using experimental machine learning. Please verify findings with the primary label text.