Fig 1 (Atorvastatinfig1)
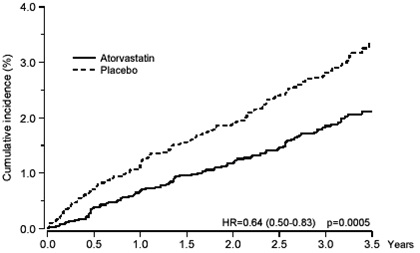
This appears to be a graph depicting the cumulative incidence of something (not specified) over a span of 35 years. There are two lines on the graph, one labeled "Atorvastatn" and the other "Placabo." It appears that the Atorvastatn line has a lower cumulative incidence percentage than the Placabo line. Additionally, there is a horizontal axis measuring time (in years) and a few numerical values provided on the vertical axis. The text at the bottom seems to indicate a hazard ratio of 0.64 with a p-value of 0.0005.*