Oxcarbazepine
Product Images NDC 50090-5003

View Photos of Packaging, Regulatory Labels, and Product Appearance

Product Visual Gallery

This gallery contains 6 technical images submitted to the FDA as part of the official labeling for Oxcarbazepine (NDC 50090-5003). Unlike standard consumer photos, these assets often include clinical data figures, molecular chemical structures, and official manufacturer packaging layouts.

As provided by A-s Medication Solutions, these visuals offer a comprehensive scientific overview of the product's physical and chemical identity, aiding pharmacists and researchers in product verification and study.

FDA Label Image

Label Image (Lbl500905003)

Label Image (Lbl500905003)
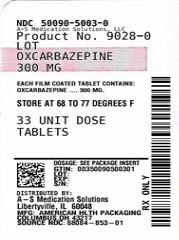
This appears to be a label or packaging information for a medication or supplement. The product is identified with the code "No." followed by a series of alphanumeric characters. It is advised to store the product at a specific temperature expressed in degrees. The product comes in small tablets, with 33 being the quantity in a package. Unfortunately, there is not enough readable text to determine the name or purpose of the medication or supplement.*
FDA Label Image

Chemical Structure (Oxcarbazepine 01)

FDA Label Image

Figure 1 (Oxcarbazepine 02)

Figure 1 (Oxcarbazepine 02)
This appears to be a survival analysis plot with the exit rate shown on the y-axis and time on the x-axis. The log-rank test was conducted and the p-value is shown as 0.0001. The plot appears to show data for a trial that took place from Day 2 to Day 11 with data for a placebo group.*
FDA Label Image

Figure 2 (Oxcarbazepine 03)

Figure 2 (Oxcarbazepine 03)
The text provides information on the seizure rate using Oxcarbazepine and Placebo treatments. A log-rank test was performed, resulting in a p-value of 0.046. The graph shows the number of days from the first dose to the first seizure in both treatment groups, with the x-axis representing time in days and the y-axis representing the number of patients experiencing a seizure. Therefore, this text is useful for analyzing the efficacy of Oxcarbazepine in preventing seizures.*
FDA Label Image

Figure 3 (Oxcarbazepine 04)

Figure 3 (Oxcarbazepine 04)
This is a survival analysis output of a log-rank test, which compares the survival of two treatment groups (HIGH and LOW) for an unknown event. The p-value is significant at 0.0001, indicating that there is a significant difference in survival between the two groups. The graph shows the percentage of individuals in each group still surviving at different time points (measured in days).*
FDA Label Image

Figure 4 (Oxcarbazepine 05)

Figure 4 (Oxcarbazepine 05)
This is a survival analysis report for a treatment group that displays the exit rate over time, measured in days. The log-rank test resulted in a p-value of 0.0001, suggesting a significant difference in survival between the high and low treatment groups. However, further information about the treatment method and study design is not available.*

* These product label images have been analyzed using experimental machine learning. Please verify findings with the primary label text.