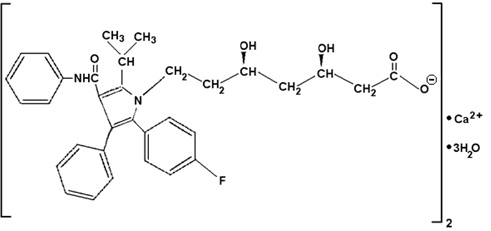
Fig 1 (Atorvastatinfig1)
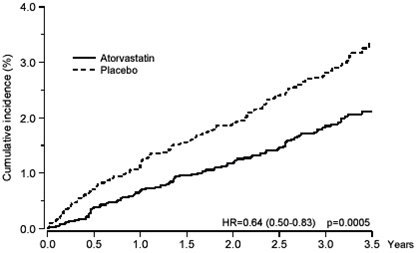
The text appears to be a portion of a graph or chart showing the cumulative incidence percentage of Atorvastatin versus Placebo. The numbers 40, 30, 20, and 10 represent the percentage on the y-axis, and the years are indicated on the x-axis from 5 to 35. The text also shows a HR (hazard ratio) of 0.64 and a p-value of 0.0005. Therefore, the description is "A graph showing the cumulative incidence percentage of Atorvastatin versus Placebo with a HR of 0.64 and a p-value of 0.0005 over a period of 5 to 35 years."*