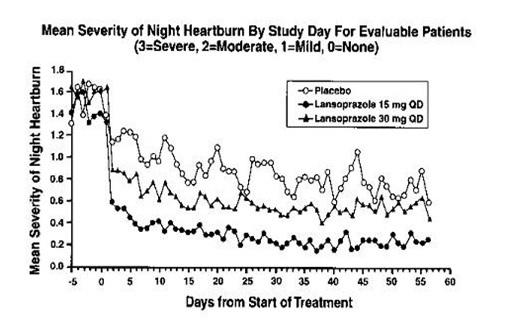
Lansoprazole-figure-1 (Lansoprazole Figure 1)
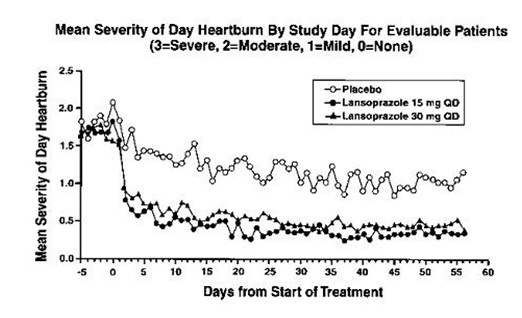
The text describes a chart or a graph that shows the mean severity of heartburn by study day for evaluable patients. The severity is measured on a scale of 0 (none) to 3 (severe). There are three treatments options listed: Placebo, Lansoprazole 15 mg, and Lansoprazole 30 mg. The graph shows that the severity of heartburn decreases over time for all treatments, and that both Lansoprazole doses perform better than the placebo. The x-axis shows the study days from the start of the treatment. The text also includes a table with some numbers, but it is not clear what these numbers are referring to.*