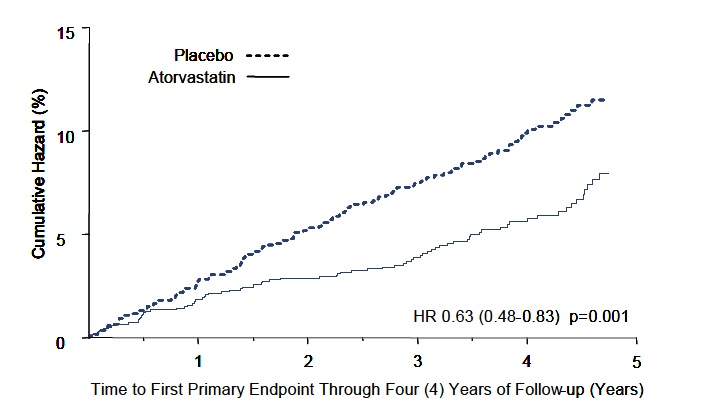
Atorvastatin-fig-1 (Atorvastatin Fig 1)
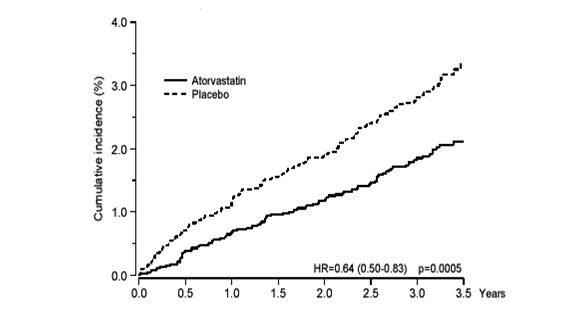
The text is describing a chart or graph, showing the cumulative incidence (%) of two things, Atorastatn and Placsbo, over a period of 35 years. The cumulative incidence for Atorastatn is shown as a solid line and the placebo is represented by a dashed line. The chart also includes some statistical information showing HR, p-value and confidence intervals but the context is not clear without further information.*