Atorvastatin-fig-1 (Atorvastatin Fig 1)
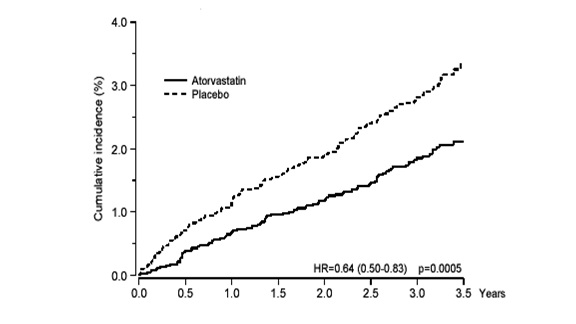
The text appears to be a graph or chart displaying the cumulative incidence percentages of Atorvastatin and Placebo over a period of 35 years. The numbers 40, 30, 20, and 10 likely denote the percentage values. The text "HR=064 (050089) p=00005" possibly represents statistical data related to the graph.*