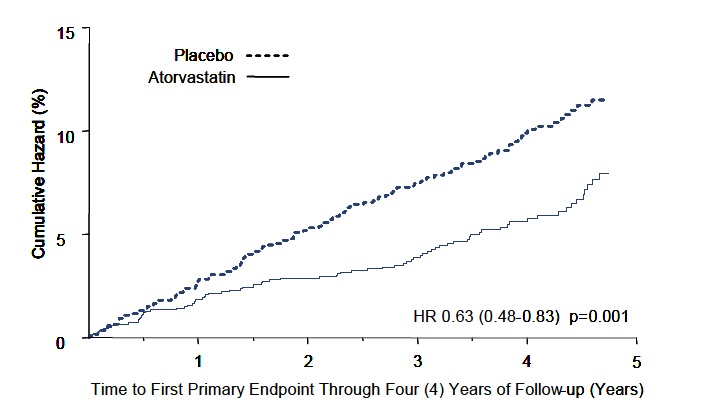
Atorvastatin-fig-1 (Atorvastatin Fig 1)
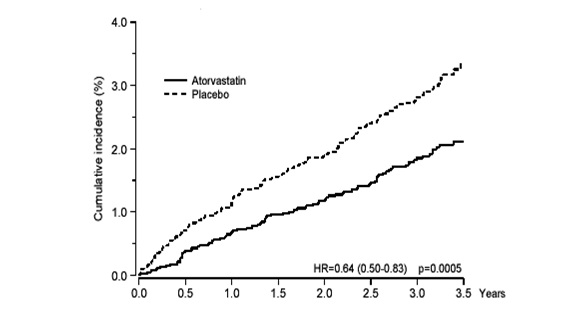
This appears to be a graph showing the cumulative incidence of a medical condition or event over a period of 35 years. The graph compares the incidence between two treatments: Atorastatin and placebo. The horizontal axis represents the duration of the treatment in years from 20 to 35. The vertical axis represents the percentage of individuals who have experienced the medical condition/event. The Atorastatin appears to have a lower cumulative incidence compared to the placebo, with a hazard ratio (HR) of 0.64 and a p-value of 0.0005.*