Figure01 (Fig01)
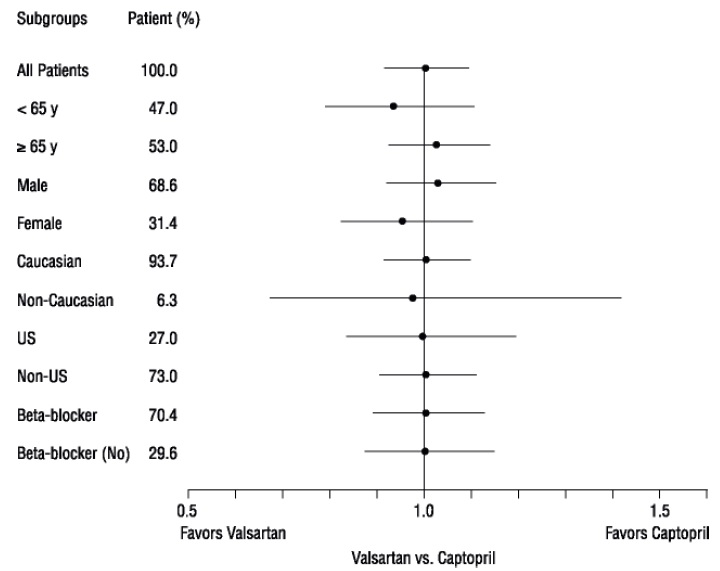
This appears to be a table displaying patient subgroups and percentages related to a comparison study between Valsartan and Captopril. The subgroups include age (<65 and 65y+), gender (male and female), ethnicity (Caucasian and non-Caucasian), location (US and non-US), and beta-blocker use (yes and no). The table also displays percentages favoring Valsartan or Captopril.*